Author: LBank Research Analyst: Ludo
Disclaimer: This report is compiled and analyzed from publicly available information and is intended solely for information sharing and research discussion. It does not constitute investment advice, a securities recommendation, a trading instruction, or any guarantee of returns. The company operations, valuations, market prices, and consensus expectations discussed herein may change over time. Readers should independently verify the data and make their own decisions.
1. Core Conclusion
Overall judgment: Shopify is a high-quality commerce infrastructure business, but its valuation still discounts prolonged exceptional growth. Our risk–reward stance is cautious at the November 5 reference price of USD 143.47. The decisive variable is cash retained after financing merchant growth, rather than the headline FCF margin alone.
-
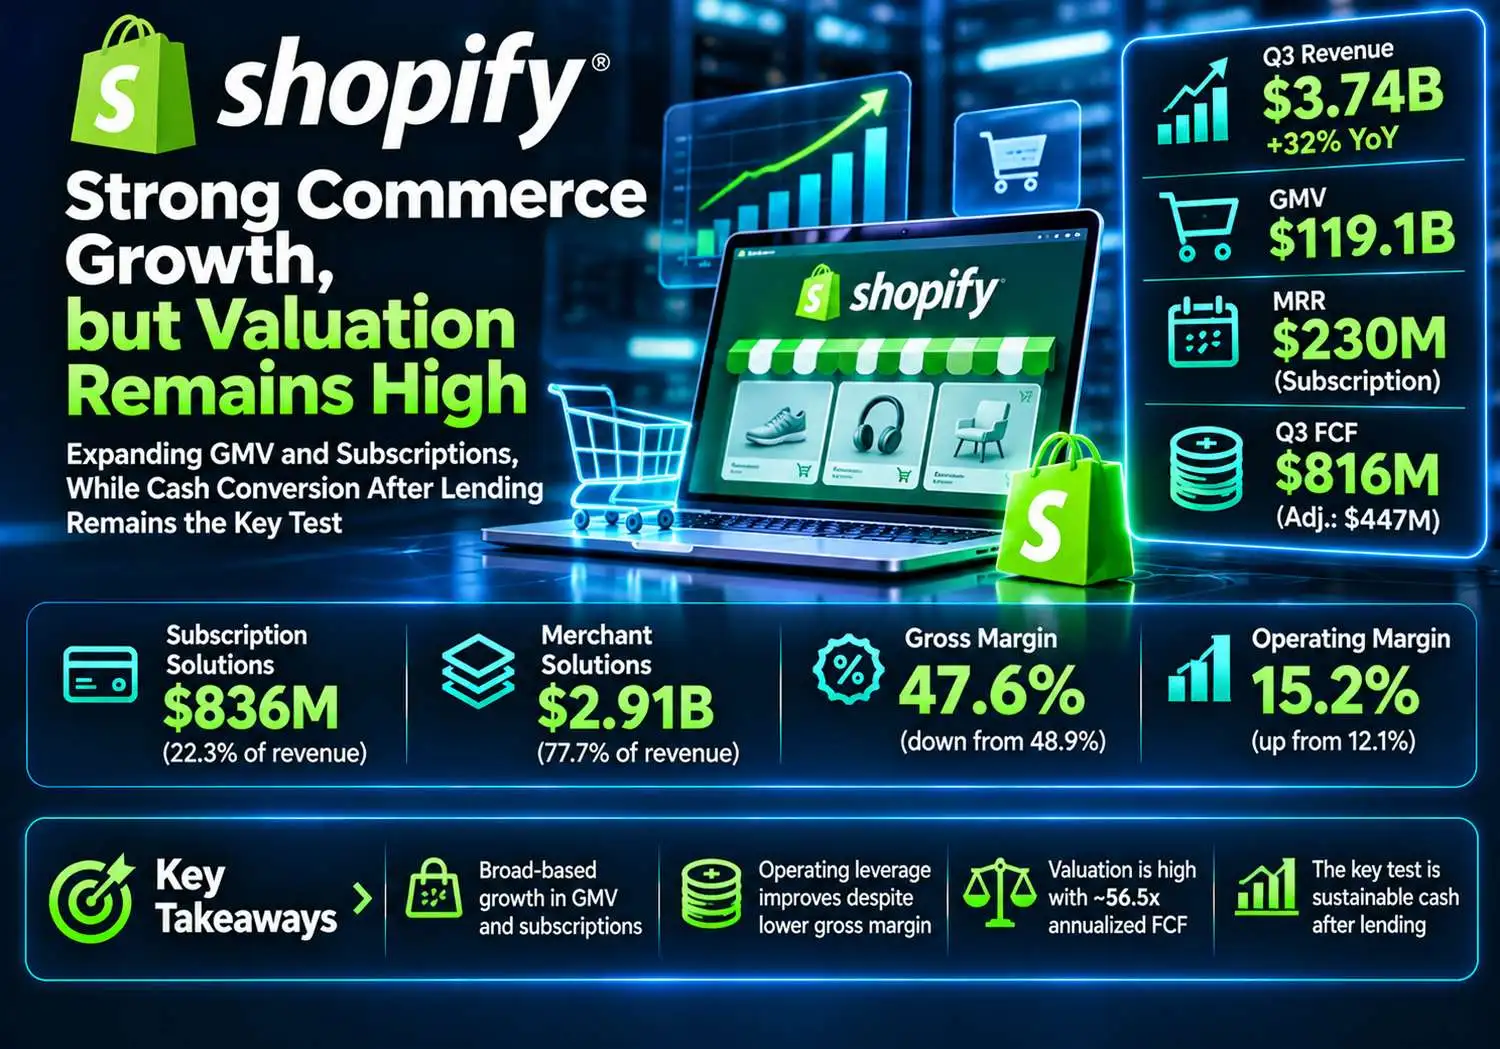
Growth is broad enough to support a durable franchise. Q3 revenue rose 32% and GMV reached USD 119.145 billion. MRR increased to USD 230 million. Activity growth and recurring subscriptions reinforce one another; the investment case does not require assigning a separate valuation to an unproven AI business.
-
Operating leverage is real despite a less favorable revenue mix. Calculated gross margin declined from 48.91% to 47.59%, while operating margin improved from 12.06% to 15.18%. This shows the platform can absorb additional transactions without matching increases in corporate spending. Revenue multiples nevertheless overstate comparability with higher-margin subscription software.
-
The cash headline needs an economic bridge. Reported FCF of USD 816 million becomes USD 587 million after USD 229 million of net lending funding. Subtracting USD 140 million of SBC as an illustrative ownership-cost allowance leaves USD 447 million. The final number is an analyst sensitivity, not company guidance, GAAP cash flow, or a prediction of buybacks.
-
The valuation leaves limited room for ordinary execution. Using September-end Class A and Class B shares of 1.286383 billion gives an estimated equity capitalization of USD 184.6 billion. That is 56.5x annualized Q3 reported FCF, 78.6x cash after net lending funding, and 103.2x after the additional SBC allowance. Even the most generous of these measures yields only 1.77%. These are seasonal quarter annualizations, not trailing or forward multiples.
-
Shopify is winning relative to weaker commerce platforms. Commerce.com reported revenue down 2.1% and NRR below 100%; Shopify's expansion is materially stronger. Q4 guidance for low-thirties revenue growth extends the operating case, but does not by itself establish an attractive equity return from the current price.
A useful valuation sensitivity separates execution from the price paid. If GMV grows 20% from Q3, blended merchant monetization stays at 2.439%, and subscription revenue grows 15%, quarterly revenue becomes USD 4.449 billion: USD 119.145 billion × 1.20 × 2.439% + USD 0.836 billion × 1.15. At an assumed 22% reported FCF margin, quarterly FCF becomes approximately USD 979 million, or USD 3.915 billion annualized. The reference equity value would still equal 47.1x that amount. This is an illustrative future-quarter scenario, not a forecast for Q4 or a price target.
Multiple compression can overwhelm that operating progress. An assumed 35x capitalization of the scenario FCF produces USD 137.0 billion, approximately 26% below the reference capitalization; 50x produces USD 195.7 billion, approximately 6% above it. Neither multiple is presented as observed peer consensus or intrinsic fair value. The exercise demonstrates how much of the return depends on investors continuing to reward strong growth at a premium. A durable increase in cash conversion after lending would improve the assessment more than another quarter of revenue growth alone.
2. Company Overview, Business Mix, and Core Operating Metrics
Shopify Inc. supplies software and services that allow merchants to manage commerce across their own online stores, physical locations and connected channels. Merchants buy access to the platform and can then use payments, currency conversion, financing and other services. Subscription revenue provides a recurring base, while merchant solutions participate in the volume and service intensity of commerce conducted on the platform. Shopify is therefore exposed to both software adoption and the spending of merchants' end customers.
The distinction matters when interpreting growth. Additional subscription revenue can carry a high incremental gross profit contribution. Payment revenue includes substantial costs paid to financial partners and networks. A higher proportion of payments can lower consolidated gross margin while increasing total gross profit and operating income. The appropriate economic question is how much incremental gross profit remains after operating costs and the capital required to support merchants.
|
Business / Q3 2026
|
Revenue, USD million
|
Gross profit, USD million
|
Economics and role
|
|
Subscription solutions
|
836
|
661
|
Platform subscriptions, enterprise plans and related services; 22.3% of revenue and 37.1% of gross profit.
|
|
Merchant solutions
|
2,906
|
1,120
|
Payments, currency conversion, lending, shipping and partner services; 77.7% of revenue and 62.9% of gross profit.
|
|
Consolidated
|
3,742
|
1,781
|
Revenue categories, not separately reported operating-profit segments.
|
Gross profit is calculated as revenue less the disclosed cost of each revenue category. Shopify does not disclose separate operating profits for these two categories, so the table does not allocate corporate expenses or imply independent segment valuations.
Core operating metrics and changes
|
Operating indicator
|
Q3 2025
|
Q3 2026
|
Interpretation
|
|
GMV, USD billion
|
92.013
|
119.145
|
29.5% calculated growth; merchant demand remains strong.
|
|
MRR, USD million
|
193
|
230
|
19.2% growth; excludes variable platform fees.
|
|
Shopify Payments volume, USD billion
|
60.1
|
81.4
|
35% disclosed growth; 68% penetration in Q3 2026.
|
|
Merchant revenue / GMV
|
2.331%
|
2.439%
|
Blended monetization proxy, not a payment processing fee.
|
|
Q4 outlook
|
—
|
—
|
Low-thirties revenue growth; high-twenties gross profit growth; operating expenses at 29–30% of revenue.
|
The November 3 results provide a strong demand signal ahead of the holiday quarter. Payments volume grew faster than total GMV as penetration reached 68%. The revenue-to-GMV ratio also improved. That ratio combines payment adoption, pricing, currency conversion, lending and other services; it cannot be used as a disclosed processing take rate. Increasing monetization is attractive only if the associated transaction costs and losses remain controlled.
MRR offers a different view of durability. It records subscription plans in force at period end and excludes variable platform fees. Multiplying it by three would not reproduce reported subscription revenue because the definitions and revenue recognition differ. It is best used as a directional indicator of the recurring subscription base rather than as a complete backlog measure.
The company expects Q4 gross profit to grow more slowly than revenue and operating expenses to represent 29–30% of revenue. That combination supports continued operating leverage, but also indicates that mix dilution has not disappeared. The stated FCF-margin outlook is relative to Q4 2025, not a promise that every subsequent quarter will match Q3's rounded 22%. Holiday seasonality and settlement timing make a single quarterly cash result an imperfect annual earnings proxy.
3. Fundamental Quality
The fundamental assessment is strong operating quality, healthy liquidity and a growing requirement to distinguish accounting cash generation from funds available for capital allocation. The business is not facing a conventional balance-sheet refinancing problem. Its more relevant risk is that a larger lending operation absorbs a rising share of the cash generated by software and payments.
|
Financial measure, USD million unless stated
|
Q3 2025
|
Q3 2026
|
Assessment
|
|
Revenue
|
2,844
|
3,742
|
Growth exceeds gross profit growth.
|
|
Gross margin
|
48.91%
|
47.59%
|
Down 132 basis points, calculated.
|
|
Operating income / margin
|
343 / 12.06%
|
568 / 15.18%
|
Operating leverage offsets gross-margin dilution.
|
|
GAAP net income / diluted EPS
|
264 / 0.20
|
462 / 0.36
|
Investment marks affect net income.
|
|
Operating cash flow
|
513
|
818
|
Cash conversion includes working-capital timing and SBC.
|
|
Property and equipment purchases
|
6
|
2
|
Company FCF deducts only this capital spending.
|
|
Reported FCF
|
507
|
816
|
Non-GAAP; 21.81% calculated current margin.
|
|
Net loan and merchant advance funding
|
147
|
229
|
Investing cash outflow; comparative classification differs.
|
|
FCF less net lending funding
|
360
|
587
|
Analyst liquidity measure; not distributable earnings.
|
|
Stock-based compensation
|
107
|
140
|
Economic dilution expense; not a current cash payment.
|
|
Cash + current marketable securities
|
5,778 (Dec 2025)
|
4,727 (Sep 2026)
|
Balance-sheet dates differ from quarterly flow columns.
|
|
Loans and merchant cash advances, net
|
1,784 (Dec 2025)
|
2,350 (Sep 2026)
|
32% expansion of capital committed to merchants.
|
|
Borrowings reported on balance sheet
|
None (Dec 2025)
|
None (Sep 2026)
|
Operating lease liabilities remain; not a zero-liability company.
|
All income-statement and operating-cash-flow measures are GAAP unless labeled otherwise. Company FCF equals operating cash flow less purchases of property and equipment. Balance-sheet comparisons use December 31, 2025 and September 30, 2026. Loan funding represents originations and purchases less repayments and sales. The prior-year presentation is not fully normalized for merchant cash advances.
Cash conversion and capital allocation
The USD 816 million reported FCF figure is arithmetically correct: USD 818 million of operating cash flow less USD 2 million of property and equipment purchases. It is also incomplete as a measure of all cash committed to growth. Lending originations and purchases of USD 1.700 billion exceeded repayments and sales of USD 1.471 billion. The resulting USD 229 million is a real use of liquidity, even though it creates financial assets rather than a current operating expense.
Beginning in April 2026, merchant cash advance flows moved from operating to investing activities. The company identifies USD 30 million of Q3 net cash use affected by this presentation change. On the former presentation, Q3 FCF would be USD 786 million rather than USD 816 million. This classification effect explains only part of the broader lending adjustment. Deducting USD 229 million and then deducting USD 30 million again would double count the reclassified amount.
Cash after net lending funding is not a liquidation value or a permanent expense burden. Loans can be repaid, sold or allowed to run down, releasing capital; continued originations may also generate attractive returns. Equally, a growing loan book is not cash available for repurchases today. Our adjustment measures liquidity committed to sustaining growth, not credit losses or the profitability of the loan portfolio. Lower funding needs in a slowdown could mechanically improve this measure while the core business weakens.
SBC requires a separate lens. Its USD 140 million cash-flow addback is legitimate because no contemporaneous cash payment occurs. Shareholders still bear an ownership cost unless repurchases offset dilution. Subtracting SBC after the lending adjustment gives the USD 447 million sensitivity used in Section 1. This is deliberately an economic allowance rather than a claim that SBC and buybacks are identical. Applying both a full SBC deduction and a separate full buyback deduction to estimate recurring earnings would mix two different approaches.
There were additional Q3 investing uses: USD 99 million for intangible assets, USD 161 million for equity and other investments, and USD 5 million for an acquisition. Subtracting all three from USD 587 million leaves USD 322 million before financing and securities-portfolio movements. These discretionary or episodic items are not assumed to recur quarterly. They explain why even the lending-adjusted measure should not be labeled unrestricted distributable cash. Repurchases of USD 562 million further illustrate the competing demands on liquidity.
Working-capital movements contributed USD 84 million to operating cash flow, versus a USD 70 million use a year earlier. That USD 154 million swing accounts for approximately half of the USD 305 million increase in operating cash flow. This does not invalidate the earnings improvement, but it cautions against capitalizing the full quarterly cash uplift as permanent operating efficiency.
The most important variable is the relationship between incremental gross profit and the total capital needed to produce it. A platform that grows payments while maintaining losses, funding requirements and dilution under control can compound shareholder value. A platform that grows the same revenue through progressively more capital-intensive lending deserves a different valuation, even if both report similar headline FCF margins.
4. Industry and Competitive Landscape
The relevant industry is merchant commerce infrastructure, covering storefront software, checkout, payments, merchant finance and distribution. It is wider than website creation and narrower than the entire retail market. A company can gain software adoption while losing control of customer discovery, or gain payment volume while accepting a lower gross margin. No single market-share figure captures all these layers.
|
Competitive layer
|
Evidence of scale
|
Main competitors
|
Investment implication
|
|
Merchant operating platform
|
Shopify Q3 GMV: USD 119.145 billion
|
Commerce.com; Wix
|
Strong commerce activity supports infrastructure relevance.
|
|
Payments and monetization
|
Shopify Payments: USD 81.4 billion
|
External processors and wallets
|
Higher adoption lifts revenue, with processing costs and credit exposure.
|
|
Demand discovery and fulfillment
|
Amazon third-party services: USD 46.492 billion
|
Amazon marketplace
|
Access to customers and delivery remain powerful competitive advantages.
|
|
AI creation and commerce
|
Wix Q2 bookings: USD 569.1 million
|
Wix Harmony; Base44; new AI tools
|
Store creation can become cheaper while transaction infrastructure remains valuable.
|
|
Company / reporting period
|
Revenue / growth
|
Comparable KPI
|
Cash or margin evidence
|
|
Shopify Inc. / Q3 2026
|
USD 3.742 billion / 32%
|
GMV +29.5%; MRR +19.2%
|
GAAP operating margin 15.18%; reported FCF USD 816 million.
|
|
Commerce.com, Inc. / Q3 2026
|
USD 84.2 million / −2.1%
|
GMV USD 9.0 billion, +14%; NRR 94.7%
|
GAAP operating loss USD 1.8 million; FCF USD 5.7 million.
|
|
Wix.com Ltd. / Q2 2026
|
USD 563.1 million / +15%
|
Bookings +12%; Business Solutions revenue +14%
|
GAAP gross margin 66%; unadjusted FCF USD 52.642 million.
|
|
Amazon.com, Inc. / Q3 2026
|
USD 201.9 billion / +12%
|
Third-party seller services +9% reported, +10% ex-FX
|
Group operating margin 13.9%; includes AWS and retail.
|
These are approximate operating comparisons, not like-for-like share measurements. Amazon revenue includes retail, cloud and other services; third-party seller services include commissions and fulfillment. Wix serves a broader website and application-creation market and its latest available results are Q2, with Q3 scheduled for November 10. GMV definitions and merchant populations differ. No peer valuation median is manufactured from these incompatible business models.
Shopify is the clearest operating winner in this comparison of merchant-platform momentum. Commerce.com is the relative loser: GMV growth has not translated into comparable subscription or total revenue growth, and NRR below 100% indicates contraction in the retained revenue base. These figures do not establish that each lost customer migrated to Shopify. They do support the narrower conclusion that Shopify currently converts commerce activity into company growth more effectively.
Wix remains a credible competitor in site creation, agency distribution and AI-assisted development. Its 15% revenue growth indicates expansion, while quarterly FCF of USD 52.642 million is below the prior-year USD 147.665 million. Growth investment can pressure cash returns before the longer-term outcome is known. Shopify cannot assume that storefront construction will remain scarce or expensive as AI tools improve. Its defense is the operational complexity of actually executing commerce: payments, inventory, merchant workflows and reliable checkout.
Amazon remains a powerful competitor for merchant budgets and consumer attention. Its third-party seller revenue rose 9% on a reported basis, but Prime Day moved into Q2 in most large markets, weakening direct Q3 growth comparisons. It would be misleading to infer a durable transfer of share from the quarterly growth gap alone. Shopify offers merchants greater control over their own customer relationship; Amazon offers a large existing demand pool and fulfillment infrastructure. Many merchants can use both.
Our base case is that Shopify is a net beneficiary of commerce becoming more distributed across channels, provided transactions continue to reach its merchant infrastructure. AI-driven discovery could expand addressable traffic, but it can also transfer negotiating power to the interfaces that originate purchases. We assign no incremental AI revenue or premium to the valuation sensitivity. Evidence of monetization must arrive through disclosed operating results rather than through product-launch narratives.
5. Key Risks
-
Consumer and merchant activity slows. GMV growth below 20% for two quarters would weaken the volume engine, reduce payments revenue and expose the stock's dependence on premium growth expectations.
-
Gross profit fails to follow monetization. Merchant revenue can rise because of mix or financing while consolidated gross margin falls. A gross margin below 46% without faster operating leverage would impair the path from revenue to equity cash returns.
-
Lending absorbs more liquidity or produces losses. Net quarterly funding above USD 300 million, accompanied by loan and transaction losses growing faster than merchant revenue, would pressure both cash availability and reported profit. Funding growth alone is not proof of deteriorating underwriting.
-
AI channels capture customer economics. If merchants adopt alternative storefronts or checkout routes and payments penetration declines, Shopify could lose revenue per unit of commerce despite healthy online spending. Retention and monetization matter more than the number of AI announcements.
-
Valuation normalizes before cash catches up. A lower capitalization multiple can offset strong operating growth, as the 35x and 50x scenarios demonstrate. The risk is especially material when a substantial share of expected return rests on a distant cash-flow scale.
-
Capital allocation reduces the ownership benefit. Repurchases above internally retained cash, additional investment purchases or persistent SBC can weaken the balance between business growth and per-share value. Investment marks also make GAAP net income volatile without necessarily changing platform execution.
-
Payment reliability or partner terms deteriorate. A serious outage, fraud event or adverse processing arrangement can reduce conversion, increase transaction losses and raise service costs simultaneously. Scale creates advantages but increases the consequences of operational failure.
6. Monitoring Checklist
The following thresholds are analyst decision rules, not management targets or market consensus.
-
Q4 revenue and gross profit: delivery near the stated low-thirties and high-twenties growth ranges supports the thesis; a material shortfall in both weakens it.
-
GMV: sustained growth above 25% supports the franchise premium; below 20% for two quarters weakens the growth-duration assumption.
-
Payments penetration: holding at or above 68% strengthens monetization; a fall below 66% warrants investigation of mix, competition and merchant adoption.
-
MRR: growth of at least 15% supports recurring-base expansion; below 10% would challenge subscription durability.
-
Margins: operating margin above 15% alongside gross margin near or above 47% supports efficient scaling. A gross margin below 46% requires an explicit offset from operating costs.
-
Cash after lending: at least USD 600 million per quarter on average, with no deterioration in losses, would improve the cash-return case. Compare several quarters rather than treating holiday settlement timing as structural.
-
SBC and capital allocation: SBC below 4% of revenue and a stable or falling share count strengthen ownership economics; repurchases should be evaluated against cash after lending and other investment needs.
-
Competitor evidence: use Wix's November 10 release, subsequent Commerce.com retention figures and Amazon's seasonally normalized seller growth to test whether Shopify's relative momentum persists.
7. Sources
Research cutoff: November 6, 2026, Asia/Shanghai; underlying equity reference: November 5 U.S. close. Financial periods and publication dates are specified above. StockAnalysis reports USD 143.47, while the retrieved Yahoo snapshot reports USD 143.75 for the same close. Calculations consistently use the former; the approximately 0.20% difference does not change the conclusion. Capitalization uses September-end shares and is an estimate, not a verified live market-cap quote. No external earnings consensus or analyst target is used.
The selection pool was verified through directly retrieved official trading HTML for SHOPUSDT, COSTON/USDT and NVOON/USDT. COST was excluded for recent coverage; NVO would repeat the prior report's pharmaceutical industry. SHOP was last covered June 22. SHOPUSDT HTML contains the stock tag, instrument identifier and nonzero embedded volume and turnover, although some visible quote fields remain unrendered. No live futures price is asserted. The spot SHOPON and VONSTOCK pages returned unpopulated shells and were not counted as verified markets. The futures contract provides derivative exposure and is not ownership of Shopify shares. Official listing pages establish entity mapping and the discovered trading links.



 Transfer