Author: LBank Research Analyst: Ludo
Coverage Type: User-authorized futures-linked single-company report. ZSUSDT is a futures contract, not a verified spot pair.
Disclaimer: This report is compiled and analyzed from publicly available information and is intended solely for information sharing and research discussion. It does not constitute investment advice, a securities recommendation, a trading instruction, or any guarantee of returns. The company operations, valuations, market prices, and consensus expectations discussed herein may change over time. Readers should independently verify the data and make their own decisions.
1. Core Conclusion
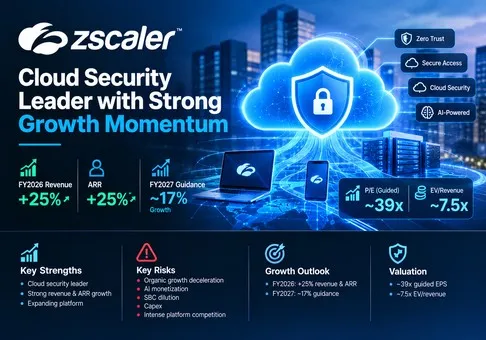
Overall view: Zscaler is a high-quality cloud-security company, but the stock is fully valued and the near-term risk-reward is moderately negative after the September 14 cybersecurity rally. Fiscal 2026 revenue and ARR each grew 25%, yet organic growth was about 20% after excluding Red Canary, while fiscal 2027 guidance implies roughly 17% growth. At the latest available September 14 price of USD 191.36, the shares trade at about 39 times guided fiscal 2027 non-GAAP EPS and enterprise value is about 7.5 times guided revenue. The decisive variable is organic net new ARR, not the intensity of the AI-security narrative.
-
The core platform is still compounding, but the headline obscures acquisition help. Fourth-quarter revenue reached USD 898.2 million and ARR reached USD 3.771 billion, both up 25%. Excluding Red Canary, revenue was USD 3.209 billion for fiscal 2026 and ARR was USD 3.630 billion, both about 20% higher; organic net new ARR grew 17% in Q4. The investment implication is that Zscaler remains a durable grower, but its current organic trajectory does not by itself justify treating 25% as the forward run rate.
-
The product surface is expanding beyond employee seats into workloads, branches, data and AI agents. Zero Trust Everywhere enterprises increased from more than 350 at fiscal 2025 year-end to more than 950 in Q4 fiscal 2026. Security for AI bookings grew more than 50% sequentially in Q4, and 70% of those deals included Data Security. This broadens wallet share and reduces dependence on user counts, but several new products remain early-stage and are expected to scale mainly in the second half of fiscal 2027.
-
Cash generation is real, but economic profitability is weaker than adjusted margins imply. Fiscal 2026 operating cash flow was USD 1.130 billion and FCF was USD 779.1 million, a 23% margin. However, stock-based compensation and related payroll taxes were USD 841.6 million, about 25% of revenue and USD 62.5 million above reported FCF. GAAP operating margin remained negative 4%. The business funds itself comfortably, yet dilution and compensation are material claims on shareholder economics.
-
The latest price again requires reacceleration. Using USD 191.36 and 163.055 million fiscal year-end shares, equity value is about USD 31.2 billion. After USD 3.474 billion of cash and short-term investments and USD 1.696 billion of convertible notes, enterprise value is about USD 29.4 billion. Against fiscal 2027 revenue guidance of USD 3.908–3.938 billion, non-GAAP EPS guidance of USD 4.86–4.90 and an implied FCF midpoint near USD 912 million, the stock is valued at roughly 7.5 times EV/Revenue, 39.2 times adjusted EPS and 34.2 times guided FCF. Those multiples are defensible only if organic ARR stabilizes above the guidance rate and new AI products become material.
-
Zscaler is winning in focused zero trust, but peers set a demanding pace. CrowdStrike reported 25% ARR growth and 26% quarterly FCF margin; Fortinet reported 26% revenue growth and a 38% non-GAAP operating margin; Palo Alto Networks reported 34% revenue growth, although acquisition effects complicate comparison. Zscaler has a differentiated inline cloud architecture and recognized SASE/SSE leadership, but it is neither the fastest-growing disclosed peer nor the cash-margin leader. The thesis turns more positive if organic net new ARR returns above 20%, fiscal 2027 revenue exceeds 18% growth, and FCF margin holds above 23% despite elevated capex.
The operating-to-valuation bridge is reproducible. Fiscal 2026 organic revenue of USD 3.209 billion growing 17% would produce about USD 3.755 billion. Adding a full-year Red Canary contribution and other acquired revenue closes much of the gap to the USD 3.923 billion midpoint of fiscal 2027 guidance. Applying the guided 23.25% FCF-margin midpoint produces about USD 912 million of FCF. At the September 14 equity value, investors are paying about 34 times that cash flow. To reduce the multiple to 30 times without a lower share price, FCF would need to exceed USD 1.04 billion, requiring a margin near 26.5% on guided revenue or materially faster revenue growth. Management instead guides to 23.0%–23.5% because capex will remain elevated. The current price therefore embeds an improvement not yet present in the formal outlook.
2. Company Overview, Business Mix, and Core Operating Metrics
Zscaler sells cloud-delivered security subscriptions through the Zero Trust Exchange. Rather than placing users, devices and applications on a common network, the platform creates identity- and policy-based connections to authorized applications. The architecture is designed to reduce internet-facing attack surfaces and prevent lateral movement after a compromise. Subscriptions are usually one to five years and revenue is recognized ratably; pricing is primarily per user or based on metered usage. Subscription and support generated about 98% of fiscal 2026 revenue, while professional services were immaterial.
Zscaler reports one operating segment, so the following view is a product-economics map rather than reported segment revenue. Zero Trust Users includes Zscaler Internet Access, Zscaler Private Access and digital-experience capabilities. This remains the installed-base engine, sold mainly to large enterprises and public-sector organizations replacing secure web gateways, VPNs and portions of legacy network security.
Zero Trust Cloud and Zero Trust Branch extend the same policy model to workloads, factories, warehouses, IoT/OT devices and cloud-to-cloud traffic. These offerings increasingly use workload, device or consumption-based economics rather than employee seats. Data Security and Security for AI inspect data flows, prompts and responses, discover shadow AI, and govern model and agent access. Agentic SecOps combines Zscaler telemetry with Red Canary's MDR capabilities to automate investigation and remediation.
|
Business area
|
Products and customers
|
Commercial model / scale proxy
|
Growth evidence
|
Research view
|
|
Zero Trust Users
|
ZIA, ZPA and ZDX for enterprise users, devices and application access.
|
Primarily per-user subscriptions; core installed-base land and expand motion.
|
More than 50% of Fortune 500 and more than 40% of Global 2000 are customers.
|
Largest proven franchise, but seat growth is maturing and bundling competition is intense.
|
|
Zero Trust Cloud
|
Workload communications, segmentation and cloud security across private and public clouds.
|
Workload and usage-oriented monetization; available through major cloud ecosystems.
|
Management cites continued momentum and multi-cloud expansion.
|
Important non-seat growth vector with strong architecture fit.
|
|
Zero Trust Branch
|
Branches, factories, warehouses and IoT/OT environments.
|
Device, site and appliance-linked economics.
|
Part of the increase to more than 950 Zero Trust Everywhere enterprises.
|
Expands addressable spend but raises hardware and infrastructure intensity.
|
|
Data Security and Security for AI
|
DLP, DSPM, AI asset discovery, prompt inspection, AI red teaming and agent policy.
|
Platform upsell and new-logo subscription opportunities.
|
Security for AI bookings grew more than 50% QoQ; 70% of deals included Data Security.
|
Best incremental growth option, though current revenue is not separately disclosed.
|
|
Agentic SecOps / MDR
|
Agentic SOC, exposure management and Red Canary managed detection and response.
|
Software plus managed service; Red Canary ARR was USD 141 million at Q4.
|
Launched Agentic SOC on September 9 after the USD 651.4 million Red Canary acquisition.
|
Strategically coherent, but integration and acquired growth must earn the purchase price.
|
|
Professional services
|
Implementation, network design, mapping and training.
|
About 2% of revenue
|
Not a material reported growth driver.
|
Supports adoption rather than forming a separate profit pool.
|
The most valuable asset is the shared inline cloud and its telemetry. Zscaler says the platform processes more than 750 billion transactions daily across more than 200 public data centers. A customer that adopts user access, workload security, branch segmentation, data controls and AI-agent governance can reuse policy and inspection infrastructure, lowering integration friction and raising switching costs. The limitation is that Zscaler must maintain high availability and efficacy across a rapidly widening portfolio.
Core Operating Metrics and Changes
The September 3 fiscal 2026 release and 10-K are the primary financial trigger. The September 9 Agentic SOC launch then converted the Red Canary acquisition into a visible product proposition. Separately, management initiated a restructuring affecting about 3% of employees, with USD 30–33 million of expected charges, while reallocating resources toward AI and growth.
|
Metric / event
|
Latest value
|
Comparison
|
Basis
|
Investment implication
|
|
Q4 revenue
|
USD 898.2 million
|
up 25% YoY
|
GAAP revenue
|
Above prior company guidance; durable demand, with acquisition contribution.
|
|
ARR / organic ARR
|
USD 3.771 billion / USD 3.630 billion
|
up 25% / up 20%
|
Company KPI; organic excludes Red Canary
|
The five-point gap is the cleanest measure of acquired growth.
|
|
Net new ARR
|
USD 246 million; USD 232 million organic
|
up 24% / up 17%
|
Q4 company KPI
|
Organic acceleration is positive, but still below the headline rate.
|
|
RPO
|
USD 7.365 billion
|
up 27% YoY
|
Contracted transaction price; 45% expected within 12 months
|
About 2.2 times fiscal 2026 revenue, supporting visibility.
|
|
Large customers
|
785 above USD 1 million ARR; 4,182 above USD 100,000
|
up 18% / up 20%
|
Q4 ending counts
|
Enterprise expansion remains broad rather than dependent on only new logos.
|
|
Q4 profitability and FCF
|
24.3% non-GAAP operating margin; USD 60.8 million FCF
|
FCF margin fell to 7% from 24%
|
Company non-GAAP and FCF definitions
|
Operating leverage improved, but accelerated infrastructure purchases depressed cash conversion.
|
|
FY2027 guidance
|
USD 3.908–3.938 billion revenue; USD 4.396–4.426 billion ARR
|
about 17% growth
|
Company outlook
|
A clear deceleration that makes organic execution the valuation test.
|
The quarter was better than the company's prior guidance, but the forward slope is more important. RPO grew faster than organic ARR, large-customer counts grew around 20%, and Z-Flex bookings exceeded USD 770 million with more than 60% sequential growth. These indicators support continued platform adoption. Yet fiscal 2027 guidance begins below the fiscal 2026 organic pace, partly because management expects seasonality and remains early in monetizing newer products.
The September 14 share-price surge of 16.3% was part of a broad cybersecurity and enterprise-software rotation linked to heightened concern about autonomous AI threats and a shift away from AI hardware. That move reinforces the strategic narrative but does not change company guidance. The operating question is whether Security for AI and Agentic SecOps can generate incremental ARR rather than merely strengthen the rationale for existing platform spend.
3. Fundamental Quality
|
Metric
|
FY2024
|
FY2025
|
FY2026
|
Research view
|
|
Revenue
|
USD 2.168 billion
|
USD 2.673 billion
|
USD 3.353 billion
|
Three-year CAGR about 24%; FY2026 organic growth about 20%.
|
|
GAAP gross margin
|
78.0%
|
76.9%
|
76.8%
|
High-quality SaaS economics, with modest infrastructure and acquisition pressure.
|
|
GAAP operating loss / margin
|
negative USD 121.5 million / negative 5.6%
|
negative USD 128.5 million / negative 4.8%
|
negative USD 133.3 million / negative 4.0%
|
Improving margin, but no GAAP operating profit.
|
|
Non-GAAP operating income
|
USD 442.2 million
|
USD 580.1 million
|
USD 767.1 million
|
Operating leverage is visible before SBC and acquisition adjustments.
|
|
Operating cash flow
|
USD 779.8 million
|
USD 972.5 million
|
USD 1.130 billion
|
Strong collections and deferred revenue support cash generation.
|
|
FCF / margin
|
USD 585.0 million / 27%
|
USD 726.7 million / 27%
|
USD 779.1 million / 23%
|
FCF grew 7%, slower than revenue because infrastructure investment rose.
|
|
Capex plus internal-use software
|
USD 194.9 million
|
USD 245.8 million
|
USD 350.5 million
|
Up 43%; fiscal 2027 equipment capex is guided to low teens as a share of revenue.
|
|
SBC and related payroll taxes
|
USD 549.1 million
|
USD 685.5 million
|
USD 841.6 million
|
About 25% of revenue in each year; the central quality discount.
|
|
Cash and short-term investments / notes
|
not used
|
USD 3.572 billion / USD 1.701 billion
|
USD 3.474 billion / USD 1.696 billion
|
Net liquidity is ample even after acquisitions.
|
Growth and margins. Revenue growth is broadening from users toward non-seat products, but the fiscal 2026 acquisition contribution is material. Gross margin remains excellent, and non-GAAP operating margin expanded to 23% for the year. GAAP progress is slower because SBC, acquired-intangible amortization and restructuring are real economic or acquisition-related costs.
Cash flow and capital intensity. FCF is genuine cash, but it benefits from SBC and deferred-revenue collections. Fiscal 2026 property, equipment and other asset purchases rose 69% to USD 277.3 million, while internal-use software investment was USD 73.2 million. Q4 spending was unusually front-loaded because components were available. Management expects fiscal 2027 equipment capex in the low teens as a percentage of revenue, with memory, storage and processor prices elevated. This keeps guided FCF margin near 23% despite adjusted operating leverage.
Balance sheet and capital allocation. Cash and short-term investments exceeded convertible notes by about USD 1.78 billion. Liquidity is not a risk. Capital allocation is more mixed: Red Canary cost USD 651.4 million and total goodwill rose to USD 1.218 billion from USD 417.7 million. Red Canary contributed USD 141 million of ARR at year-end, implying a purchase price near 4.6 times that ARR before considering retention awards and integration. The deal has strategic logic, but returns depend on cross-selling Agentic SecOps rather than preserving acquired revenue alone.
Fundamental conclusion. Zscaler's fundamental quality is strong because recurring revenue, RPO, enterprise penetration and cash generation reinforce one another. The single most important variable is organic net new ARR. It measures whether new product adoption and sales productivity can offset seat maturation without relying on acquisitions.
4. Industry and Competitive Landscape
Zscaler competes across Security Service Edge, SASE, zero-trust network access, secure web gateways, cloud workload security, data security and increasingly SOC automation. No single public market-share denominator covers this full surface. Vendor ARR definitions also differ: Zscaler ARR covers next-12-month subscription revenue; CrowdStrike reports platform subscription ARR; Palo Alto Networks NGS ARR excludes hardware and legacy attached offerings; Fortinet emphasizes revenue and billings. Comparisons are therefore directional.
|
Competitive dimension
|
Zscaler's verifiable position
|
Scale proxy and limitation
|
Main competitors / substitutes
|
Growth and valuation implication
|
|
SSE and zero-trust access
|
Recognized by Gartner as a 2026 Leader in both SASE Platforms and SSE.
|
Third-party positioning, not audited market share.
|
Palo Alto Networks, Netskope, Cisco, Fortinet and Microsoft.
|
Leadership supports premium pricing; suites can compress it.
|
|
Cloud scale and telemetry
|
More than 750 billion daily transactions across more than 200 public data centers.
|
Company-disclosed processing scale; competitors use different definitions.
|
Hyperscaler-native controls and global security clouds.
|
More traffic improves detection context, but requires sustained infrastructure investment.
|
|
Enterprise distribution
|
About 11,000 customers; more than 50% of Fortune 500 and 40% of Global 2000.
|
Customer count is not equivalent to wallet share.
|
Microsoft bundling, PANW platformization, CRWD Falcon Flex and channel-led Fortinet.
|
Deep penetration enables upsell but leaves fewer untouched mega-enterprise logos.
|
|
AI and data security
|
Security for AI bookings grew more than 50% QoQ; Data Security ARR exceeded USD 500 million at the June investor session.
|
Bookings and ARR are different measures; product revenue is undisclosed.
|
PANW, CRWD, Microsoft, Fortinet and specialist DSPM / AI-security vendors.
|
The largest optionality, but current valuation already assumes monetization.
|
|
SOC and response
|
Agentic SOC integrates inline policy enforcement with Red Canary MDR.
|
Newly launched; no stand-alone revenue or retention disclosure.
|
CRWD Falcon / Next-Gen SIEM, PANW Cortex and Microsoft Sentinel.
|
Closed-loop remediation can increase wallet share if integration proves superior.
|
|
Company
|
Latest comparable period
|
Revenue / recurring scale
|
Growth / profitability
|
Operating and investment context
|
Competitive conclusion
|
|
Zscaler
|
Q4 FY2026
|
USD 898 million revenue; USD 3.771 billion ARR
|
25% revenue and ARR growth; 24% non-GAAP operating margin; 7% FCF margin
|
Organic ARR growth was 20%; Q4 capex was accelerated.
|
Focused zero-trust winner, but not the current cash-margin leader.
|
|
CrowdStrike
|
Q2 FY2027
|
USD 1.47 billion revenue; USD 5.84 billion ARR
|
25% ARR growth; 25% non-GAAP operating margin; 26% FCF margin
|
Falcon Flex ARR exceeded USD 2.29 billion and grew 101%.
|
The momentum winner in endpoint, identity and security operations.
|
|
Palo Alto Networks
|
Q4 FY2026
|
USD 3.41 billion revenue; USD 9.10 billion NGS ARR
|
34% revenue; 63% NGS ARR; about 29% non-GAAP operating margin
|
Acquisitions materially affect growth and comparability; FY2026 adjusted FCF margin was 38.4%.
|
The broad platform-scale winner, with integration risk.
|
|
Fortinet
|
Q2 2026
|
USD 2.05 billion revenue; USD 2.37 billion billings
|
26% revenue; 33% billings; 38% non-GAAP operating margin
|
ASIC and appliance economics support secure-networking convergence.
|
The profitability winner, especially where hardware and networking matter.
|
Note: Fiscal periods, product mixes and KPI definitions differ. PANW's NGS ARR includes acquired businesses and is not comparable with Zscaler ARR. Fortinet sells hardware and reports billings rather than ARR. Quarterly FCF is seasonal; Zscaler's full-year fiscal 2026 FCF margin was 23%.
CrowdStrike is currently winning the cleanest momentum contest: ARR grew 25%, net new ARR accelerated 51%, and FCF margin reached 26%. Palo Alto Networks is winning platform breadth and contract scale, but acquisition effects make its 63% NGS ARR growth unsuitable as an organic benchmark. Fortinet is winning on GAAP and adjusted profitability. Zscaler is winning focused SSE and zero-trust architecture while broadening into data, branches and AI, but the company must demonstrate that product breadth converts to organic growth.
Point-product vendors without proprietary telemetry or distribution are the structural losers as customers consolidate platforms. Zscaler is a net beneficiary of that consolidation because its installed base can absorb more modules. It becomes a relative loser if Microsoft, PANW or CRWD bundles adjacent capabilities at lower incremental prices, or if Zscaler's new SOC and endpoint products fail to match specialist depth.
5. Key Risks
-
Organic deceleration. If organic ARR growth falls below 17% or net new ARR stops accelerating, fiscal 2027 revenue could miss the high-teens plan. With the stock near 39 times guided adjusted EPS, a lower growth rate would compress both earnings expectations and the multiple.
-
AI monetization arrives later than the narrative. Zero Trust Exchange for Agents and Endpoint AI Security are expected to scale mainly in the second half of fiscal 2027. If Security for AI bookings fail to convert into ARR or remain bundled, the September re-rating would lack an incremental revenue pool.
-
SBC and dilution. Fiscal 2026 SBC and related payroll taxes equaled roughly 25% of revenue and exceeded reported FCF. If shares outstanding continue rising near 3% annually without GAAP profitability, per-share value creation will trail headline cash generation.
-
Capital intensity and component inflation. Management expects equipment capex in the low teens as a percentage of fiscal 2027 revenue because memory, storage and processor costs are elevated. If capex rises above 13% while FCF margin falls below 22%, the cloud model's perceived asset-light advantage would weaken.
-
Acquisition and goodwill risk. Goodwill rose to USD 1.218 billion, and Red Canary contributed USD 141 million of ARR after a USD 651.4 million cash purchase. Weak retention or limited cross-sell would reduce organic growth, create impairment risk and undermine Agentic SecOps economics.
-
Platform competition and bundling. PANW, CRWD, Fortinet and Microsoft can combine security modules with broader contracts. If Zscaler must discount Z-Flex or spend more on sales to defend renewals, gross margin and sales productivity would deteriorate before customer counts show weakness.
-
Security or availability failure. Zscaler sits inline with customer traffic. A material outage, missed attack or platform vulnerability could trigger service credits, delayed renewals and reputational damage, directly impairing ARR and the premium multiple.
-
Execution during restructuring. A 3% workforce reduction can improve resource allocation, but disruption in engineering or go-to-market teams could delay new products. The warning signal would be weaker organic net new ARR alongside rising R&D or sales expense.
-
Futures-versus-equity basis risk. The cited LBank instrument is ZSUSDT Futures, not Nasdaq common stock or a verified LBank spot token. Funding, leverage, liquidity and tracking can cause returns to diverge from the underlying equity discussed in this report.
6. Monitoring Checklist
-
Q1 fiscal 2027 revenue: USD 939 million or above would support better-than-guided growth; below USD 935 million would weaken the thesis.
-
Organic ARR growth: 20% or higher would show stabilization and strengthen valuation support; below 17% would confirm faster deceleration.
-
Organic net new ARR: growth above 20% for two quarters would validate sales productivity and new products; below 15% would challenge the reacceleration thesis.
-
Security for AI conversion: continued bookings growth above 30% sequentially and disclosed ARR contribution would strengthen the AI case; bookings growth without ARR disclosure remains insufficient.
-
Zero Trust Everywhere enterprises: growth from more than 950 to at least 1,150 by mid-fiscal 2027 would confirm non-seat expansion; a plateau below 1,050 would weaken it.
-
Margins and capex: non-GAAP operating margin at or above 24% with FCF margin above 23% would show leverage. Equipment capex above 13% of revenue or FCF margin below 22% would be negative.
-
SBC: a decline below 22% of revenue would improve economic quality; remaining near 25% keeps dilution as a major offset to FCF.
-
Peer momentum: compare Zscaler organic ARR and FCF margin with CRWD, PANW and FTNT. Zscaler needs at least comparable organic growth or a clearer product-share gain to defend its multiple.
-
Valuation: below 32 times fiscal 2027 non-GAAP EPS with unchanged guidance would improve risk-reward; above 40 times without organic ARR above 20% would indicate narrative-led overextension.
-
LBank contract basis: monitor ZSUSDT funding, liquidity and tracking versus Nasdaq ZS, because the research conclusion addresses Zscaler equity fundamentals rather than leveraged-contract microstructure.
7. Sources