Author: LBank Research Analyst: Ludo
1. Core Conclusion
Overall judgment: Eli Lilly and Company is a high-quality growth business, but its valuation is demanding and the risk-reward is moderately unfavorable at the verified reference price. The decisive variable is the cash retained from expanded metabolic-drug access after price concessions, manufacturing investment and external pipeline purchases. Volume leadership deserves a premium; it does not establish that the current premium offers an adequate return.
-
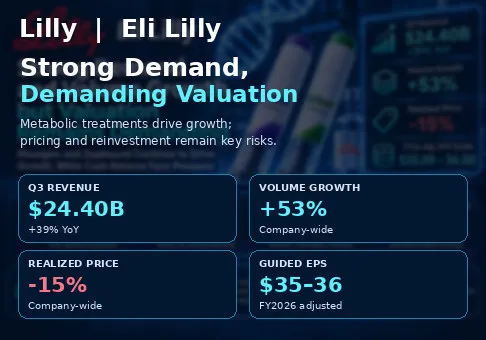
Demand is strong enough to absorb substantial price erosion. Q3 revenue reached USD 24.397 billion, up 39%, with a company-reported volume contribution of 53% and realized-price contribution of negative 15%. The operating franchise is expanding. The investment implication is that declining net prices need not imply declining revenue, but growth increasingly depends on adding and retaining treatments.
-
The earnings downgrade is primarily an acquisition-accounting issue. Non-GAAP EPS guidance moved from USD 35.50–36.50 to USD 35.00–36.00. Management describes a USD 4.07 improvement in underlying midpoint expectations offset by USD 4.57 of Q3 acquired IPR&D. Treating the lower headline guidance as a demand warning would misread the bridge; automatically ignoring the acquisition cost would overstate economic profitability.
-
Recurring growth is below the headline print. Removing approximately USD 0.900 billion of disclosed revenue benefits gives USD 23.497 billion, or 33.5% growth against unadjusted prior-year revenue. This is an analytical sensitivity, not organic growth: the prior quarter also had unusual revenue. Even this conservative calculation supports strong demand, while discouraging direct annualization of the reported quarter.
-
Ordinary FCF overstates immediately distributable cash. Nine-month CFO less capex is USD 18.983 billion. Deducting purchased IPR&D of USD 7.548 billion leaves USD 11.435 billion; subtracting another USD 10.692 billion of cash acquisitions leaves USD 0.743 billion before dividends and repurchases. These are analytical cash bridges, not company-defined FCF. Capital allocation matters as much as commercial execution.
-
A premium multiple already discounts durable success. At the issuer-hosted November 3 stock close of USD 1,409.38, the price is 39.7x the USD 35.50 guided non-GAAP EPS midpoint. Adding back only Q3 acquired IPR&D gives an explicitly partial sensitivity of USD 40.07 and 35.2x. Neither is a next-year consensus multiple. Strong growth can justify elevated valuation, but further rerating requires evidence that access expansion creates durable retained cash.
The reference quote is a verified historical stock price, not a November 5 live quote or an LLYON token price. The multiple should be refreshed before use. No broker consensus or price target is assumed in this report.
A simple valuation sensitivity illustrates the hurdle. At unchanged USD 35.50 EPS, a 35x multiple implies USD 1,242.50, approximately 11.8% below the reference price. To maintain that price at 35x requires USD 40.27 EPS, 13.4% above the guidance midpoint. This is arithmetic rather than a forecast or target; it identifies how much earnings progress is needed to absorb moderate multiple normalization.
2. Company Overview, Business Mix, and Core Operating Metrics
Lilly earns revenue by developing and commercializing prescription medicines through healthcare distribution and reimbursement systems. Patients create demand, prescribers influence adoption, and governments, insurers and intermediaries determine much of the effective access and net realization. Revenue therefore depends on treatment volume, duration, product and geographic mix, and rebates. A list-price comparison alone cannot explain its economics.
Mounjaro and Zepbound form the principal commercial engine. They share exposure to tirzepatide but serve different branded markets and indications. Counting them as separate products is useful for sales analysis; counting them as unrelated technological risks would be misleading. A manufacturing interruption or safety issue affecting their common platform could transmit across both franchises.
|
Business / product
|
Q3 2026 revenue, USD billion
|
Economic role
|
|
Mounjaro
|
10.723
|
Diabetes franchise; international reimbursement expands reach but lowers realized price.
|
|
Zepbound
|
5.352
|
Obesity franchise; demand and coverage drive treatment volumes.
|
|
Other Key Products
|
0.994
|
Jaypirca, Ebglyss, Kisunla, Omvoh, Foundayo and Inluriyo; diversified growth options.
|
|
Remaining portfolio
|
7.328
|
Residual including established diabetes, oncology and other medicines; not a reported segment.
|
|
Total
|
24.397
|
Product groupings above are research aggregations, not operating segments.
|
The remaining portfolio provides established revenue and diversification across therapeutic areas. The six smaller Key Products are aggregated here to keep the scale comparison transparent. Their combined revenue equals USD 0.228 billion plus USD 0.202 billion plus USD 0.193 billion plus USD 0.114 billion plus USD 0.184 billion plus USD 0.073 billion. Subtracting those products and the two leading brands from total revenue gives the residual portfolio. These groupings do not imply separately reported operating profit; product-level margins are not estimated.
Core operating metrics and changes
|
Operating indicator
|
Latest observation
|
Interpretation
|
|
Worldwide volume / realized price
|
+53% / −15%
|
Company-wide revenue bridge; not a same-patient unit-price series.
|
|
U.S. volume / realized price
|
+41% / −7%
|
Access expansion must offset concessions.
|
|
Outside-U.S. volume / realized price
|
+76% / −29%
|
China reimbursement creates substantial mix pressure.
|
|
Q3 revenue benefits
|
USD 0.900 billion
|
Includes USD 0.410 billion Jardiance milestones; no further milestones remain.
|
|
2026 revenue guidance
|
USD 91.0–92.0 billion
|
Prior range USD 85.0–87.0 billion.
|
|
2026 non-GAAP EPS guidance
|
USD 35.00–36.00
|
Includes acquired IPR&D; midpoint down USD 0.50 despite stronger underlying business.
|
The international bridge is the main warning against extrapolating treatment counts into sales. Broader reimbursement can unlock a large addressable population while shifting revenue toward lower net realization. That can still create value when incremental manufacturing and distribution costs are low enough. The correct test is incremental contribution and persistence, not whether international average pricing matches U.S. pricing.
The reported price and volume contributions are company accounting bridges. They should not be multiplied as though they were an exact constant-product index: 1.53 multiplied by 0.85 is about 1.30, not the reported revenue growth factor. Product mix, bridge definitions, currency and rounding affect reconciliation. Any forecasting model should specify its own constant-mix assumptions instead of forcing the published contributions into a mechanical identity.
The following forward sensitivity is deliberately separate from those reported bridge figures. Start with Q3 combined Mounjaro and Zepbound revenue of USD 16.075 billion. Assume next-year comparable treatment volume rises 20%, constant-mix net realization falls 10%, and other factors are unchanged. Revenue becomes 16.075 × 1.20 × 0.90 = USD 17.361 billion, an 8% increase. At an assumed incremental operating margin of 50%, the USD 1.286 billion quarterly revenue increment yields USD 0.643 billion operating profit. Applying an assumed 20% tax rate gives USD 0.514 billion incremental quarterly after-tax operating profit, or USD 2.058 billion annualized.
Cash would equal that last figure only before incremental working capital, capex, financing costs and external pipeline spending. At 30x this hypothetical annual profit increment, the associated equity-value sensitivity is USD 61.73 billion before those deductions. The scenario is not management guidance. It shows why very strong patient growth can yield much more modest revenue growth and why a large installed franchise does not eliminate sensitivity to price and reinvestment.
3. Fundamental Quality
|
Financial metric
|
Prior comparable period
|
Latest comparable period
|
|
Q3 revenue, USD billion
|
17.601
|
24.397
|
|
Q3 GAAP gross margin
|
82.9%
|
83.9%
|
|
Q3 GAAP net income, USD billion
|
5.583
|
6.451
|
|
Q3 GAAP diluted EPS, USD
|
6.21
|
7.22
|
|
Q3 non-GAAP EPS, USD
|
7.02
|
7.48
|
|
Nine-month CFO, USD billion
|
13.588
|
27.420
|
|
Nine-month capex, USD billion
|
5.294
|
8.437
|
|
Nine-month CFO less capex, USD billion
|
8.294
|
18.983
|
|
Nine-month purchased IPR&D, USD billion
|
2.584
|
7.548
|
|
Nine-month cash acquisitions, USD billion
|
0.549
|
10.692
|
|
Cash, USD billion; December 2025 / September 2026
|
7.268
|
4.885
|
|
Long-term debt including current portion, USD billion; same balance dates
|
42.503
|
49.503
|
Quarterly income-statement figures compare Q3 2026 with Q3 2025; cash-flow figures compare the first nine months of each year. Balance-sheet dates are stated separately. CFO less capex is calculated consistently in both periods. Debt in the table covers long-term debt including its current portion and should not be presented as a comprehensive net-debt measure.
Growth quality is strong because the business is selling substantially more medicines while improving GAAP gross margin. Nevertheless, rebate estimates can shift recognized sales between periods. The approximately USD 0.900 billion of benefits should be treated as a normalization item rather than evidence that every revenue dollar has the same repeatability. Jardiance milestones are especially unsuitable as a recurring run rate because the company says no further milestones remain.
Margin quality is also strong, but the sustainability of incremental returns is more important than the gross-margin level. Lower manufacturing cost and mix can offset net-price declines for a period. A high gross margin provides a buffer, yet it does not prove that a lower-price market generates the same return after marketing, R&D and infrastructure. Using the group margin as a product-specific contribution margin would exaggerate model precision.
Cash conversion has materially improved. CFO rose faster than revenue over the nine-month comparison, while capex also increased. That supports the view that commercial growth is producing real operating cash. However, the CFO reconciliation adds back acquired IPR&D charges, while cash purchases of IPR&D appear in investing activities. An investor who uses CFO less capex without reading the investing statement can miss an important recurring use of capital.
The economic treatment requires judgment. External pipeline spending can be discretionary in a single year and may create valuable future assets. It is not reasonable to assume all purchases recur at exactly this pace. It is equally unreasonable to assume an innovation-dependent pharmaceutical business can permanently stop replenishing its pipeline without affecting future growth. The analytical bridge therefore presents both conventional FCF and cash after external investment, without calling either one normalized distributable earnings.
Capital allocation is the weaker component of an otherwise strong quality assessment. Cash fell while the carrying value of long-term debt increased. This does not establish financial distress; operating cash generation remains substantial. It does mean that buybacks, dividends, manufacturing and acquisitions compete for the same financial capacity. Acquisition success must ultimately be measured by approved products and commercial cash returns, not by whether a charge is excluded from a preferred earnings narrative.
The single most important variable is incremental retained cash per unit of expanded access. That combines net realization, persistence, production efficiency and reinvestment intensity. An improvement in that variable would make today's valuation easier to defend. Continued revenue growth accompanied by equally rapid external spending would leave the valuation case much less secure.
4. Industry and Competitive Landscape
The relevant industry includes branded diabetes and obesity therapies, payer access, drug manufacturing and adjacent specialty pharmaceutical franchises. The obesity market is expanding, but market growth does not accrue to manufacturers without friction. Prescribers, patients and payers can prefer different attributes: efficacy, tolerability, convenience, clinical outcomes, affordability and reimbursement. Those preferences determine realized economics.
|
Industry layer
|
Evidence / economic position
|
Valuation implication
|
|
Branded metabolic therapies
|
Mounjaro plus Zepbound: USD 16.075 billion quarterly sales; 65.9% of Lilly revenue.
|
Large scale supports manufacturing economics and magnifies concentration risk.
|
|
Payer access
|
Lilly volume +53% with realized price −15%.
|
Patient expansion must exceed net-price erosion.
|
|
Oral obesity competition
|
Novo Wegovy pill Q3 sales DKK 5.394 billion.
|
Convenience can shift mix and access; injectable leadership alone is insufficient.
|
|
Specialty diversification
|
Lilly other Key Products aggregate USD 0.994 billion.
|
Useful optionality, still small relative to tirzepatide.
|
|
Manufacturing and capital
|
Lilly nine-month capex USD 8.437 billion.
|
Capacity supports growth but consumes cash before full utilization.
|
Industry leadership cannot be summarized by one share statistic. Revenue share, prescription share, new-patient starts, treatment duration and geographic coverage answer different questions. Novo's disclosed U.S. branded-obesity new-patient share above 50% cannot be applied to worldwide metabolic revenue or used to infer Lilly's complementary share across all channels. The report therefore uses disclosed sales and clearly bounded KPIs instead of fabricating a universal market-share ranking.
|
Company / comparable period
|
Revenue or KPI
|
Growth / profitability
|
Competitive assessment
|
|
Eli Lilly and Company; Q3 2026
|
USD 24.397 billion revenue
|
39% revenue growth; 83.9% GAAP gross margin
|
Net beneficiary of metabolic demand expansion.
|
|
Novo Nordisk A/S; Q3 2026
|
Wegovy pill sales DKK 5.394 billion
|
Sales +4% CER; adjusted operating profit +27% CER
|
Oral growth winner; disclosed branded-obesity new-patient share above 50% is a narrower U.S. metric.
|
|
Amgen Inc.; Q3 2026
|
USD 10.4 billion revenue
|
8% growth; USD 3.7 billion FCF
|
Diversified commercial winner; pipeline exposure does not equal current obesity sales.
|
|
Pfizer Inc.; Q3 2026
|
USD 16.583 billion revenue
|
Approximately flat reported revenue; USD 0.87 adjusted EPS
|
Relative growth laggard; acquired/launched products provide recovery potential.
|
All comparisons use Q3 2026, but currencies, accounting definitions and therapeutic exposure differ. CER means constant exchange rates. Novo's adjusted operating-profit growth benefits from a prior-year comparison affected by transformation costs; it is not a directly comparable operating-margin signal. Amgen's FCF and Pfizer's adjusted EPS are their respective company measures. No peer P/E ranking is supplied without aligned stock prices and earnings definitions.
Lilly is the clearest growth winner in this comparison and a net beneficiary of expanding metabolic treatment. Novo is a winner in oral adoption and retains a meaningful competitive position, rather than being a simple loser because Lilly grows faster. Its pill sales demonstrate that convenience can capture real demand. That is a commercial challenge to any assumption that injectable leadership alone secures the entire future market.
Amgen is a diversified commercial winner with a relevant development pipeline, but current enterprise revenue is not evidence of established obesity revenue. Pfizer is the relative top-line growth laggard in the table, even though newer products support recovery. These distinctions matter for valuation: lower-growth peers can generate substantial cash, while Lilly's premium requires a more durable reinvestment runway.
The competitive conclusion is positive for Lilly's operations and cautious for its shares. Scale, manufacturing learning and a large commercial base strengthen its position. Greater access also increases payer bargaining leverage and exposes revenue to lower-price markets. Winning more treatments creates shareholder value only if the associated return survives the full chain of discounts, cost, reinvestment and financing.
5. Key Risks
-
Price erosion exceeds volume compensation. If annual net realization falls 15%, volume must rise approximately 17.6% merely to keep constant-mix revenue flat: 1 / 0.85 − 1. Slower treatment growth would pressure sales, factory utilization and the valuation premium simultaneously.
-
Revenue-estimate benefits reverse. If favorable rebate and discount adjustments unwind, reported growth and gross profit could fall without an equivalent change in underlying prescription demand. Investors extrapolating the latest quarter would face a sharper earnings reset.
-
Manufacturing expansion earns inadequate returns. If demand shifts or plants ramp slowly after heavy capex, depreciation and idle capacity can rise before sales materialize. Cash recovery would weaken even if the addressable market remains large.
-
Platform concentration creates correlated downside. A material safety, quality or supply event affecting tirzepatide could impair both major brands. The combined 65.9% revenue exposure makes an apparently product-specific issue important at group level.
-
External innovation becomes a recurring cash burden. If purchased IPR&D and acquisitions remain elevated without corresponding launches, conventional FCF will continue to overstate available shareholder cash. Further debt funding could reduce flexibility and compound execution risk.
-
Oral therapies alter treatment economics. If competing pills capture incremental patients or induce switching, the injectable franchise could experience weaker mix and pricing. Lilly's own newer products must generate incremental demand rather than simply redistribute existing revenue.
-
Multiple normalization outruns earnings. If investors require a lower premium while cash returns remain uncertain, earnings growth may fail to translate into stock appreciation. The 35x sensitivity above quantifies a modest normalization rather than assuming an extreme collapse.
6. Monitoring Checklist
These thresholds are research decision rules, not management commitments or statistical confidence intervals.
-
Metabolic franchise sales: growth above 20% would support continued scale gains; below 10% for two comparable quarters would weaken the premium-growth case.
-
Volume versus price: a constant-mix model with 10% price erosion needs more than 11.1% volume growth to expand sales. Track the underlying bridge and avoid treating reported company-wide contributions as an exact product index.
-
Revenue normalization: separate milestones and rebate-estimate changes every quarter. A result that depends materially on such benefits would weaken confidence in recurring growth.
-
Gross margin: sustained GAAP margin above 82% would support manufacturing and mix resilience; below 80% for two quarters would challenge the cost-offset assumption.
-
Cash after external pipeline investment: monitor CFO less capex, purchased IPR&D and acquisitions separately. A rolling-year result below zero before shareholder distributions would increase concern about capital allocation.
-
Balance-sheet discipline: long-term debt including current maturities rising above USD 55 billion without stronger retained cash would weaken the funding assessment; stable debt and recovering cash would strengthen it.
-
Competitive demand and persistence: compare oral launches, appropriately scoped new-patient metrics and sales progression. Sustained adoption accompanied by weaker injectable net realization would demand a more conservative franchise model.
-
Valuation hurdle: refresh the underlying stock quote and earnings basis together. A move toward 35x guided EPS would reduce valuation risk, while the same multiple achieved only by excluding repeated acquisition costs would offer less reassurance.
7. Sources
Research cutoff: November 5, 2026, Asia/Shanghai. Financial results are through Q3 2026. The latest verified stock close in the accessed issuer lookup is November 3, 2026; no November 4 close is asserted. Calculations and scenario assumptions are this report's analysis. No external consensus is used.
LBank screening opened LLYON, COSTON and MAON spot interfaces before final company selection. Each exposed a named pair, market statistics, chart controls and buy/sell inputs. Official listing notices identify the corresponding companies. The displayed token quotes have uncertain observation timestamps and are omitted from equity valuation. Token exposure has its own product terms and is not treated here as direct ownership of NYSE-listed shares. COST and MA had recent coverage; LLY had no recorded coverage within the preceding 90 days.



 Transfer