Author: LBank Research Analyst: Ludo
Disclaimer: This report is compiled and analyzed from publicly available information and is intended solely for information sharing and research discussion. It does not constitute investment advice, a securities recommendation, a trading instruction, or any guarantee of returns. The company operations, valuations, market prices, and consensus expectations discussed herein may change over time. Readers should independently verify the data and make their own decisions.
1. Core Conclusion
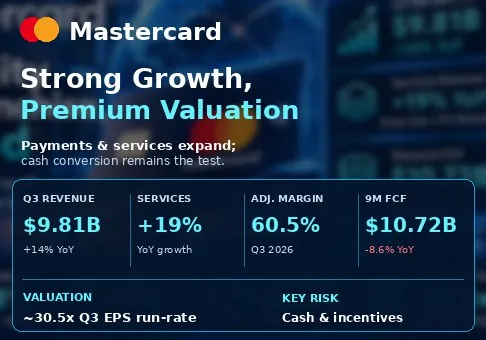
Overall assessment: Mastercard Incorporated is a high-quality payments franchise with improving services mix, but the stock is fully valued at USD 647.18; the risk/reward is neutral to cautious. The most important variable is whether incremental network and services revenue becomes cash after customer incentives. The thesis concerns consumer spending, travel, merchant acceptance and commercial contract economics.
-
The core network is growing without requiring a consumer lending balance sheet. Q3 net revenue increased 14% to USD 9.807 billion, supported by 7% local-currency gross dollar volume growth, 11% cross-border growth and 9% switched transaction growth. This combination supports durable mid-teens revenue expansion, but volumes are client activity rather than funds Mastercard owns.
-
Services improve the growth mix. Value-added services and solutions revenue rose 19%, versus 11% for payment network revenue, both reported and currency-neutral. Security, analytics and other services can deepen client relationships. Their faster expansion makes the franchise more valuable than a transaction-count-only model, although the release does not provide separate operating margins for these categories.
-
Reported profit growth exceeds the improvement in underlying cash generation. GAAP operating margin reached 59.8%, and adjusted margin 60.5%. Yet nine-month operating cash flow fell from USD 12.646 billion to USD 11.859 billion. A conservative research FCF definition, subtracting both property expenditure and capitalized software, gives USD 10.718 billion, down 8.6%. Customer-related prepayments and other working-capital movements deserve as much attention as EPS.
-
Valuation already rewards the business quality. At the November 3 regular close of USD 647.18, annualized Q3 adjusted EPS of USD 5.31 implies 30.5x earnings; annualized nine-month adjusted EPS of USD 14.94 implies 32.5x. These are mechanical run-rate measures, not forward consensus multiples. Using 873 million period-end Class A and B shares as a valuation proxy gives USD 565.0 billion equity value and a 2.53% yield on annualized nine-month research FCF.
-
Capital returns are large, but partly supported by financing. Nine-month treasury purchases of USD 11.893 billion and dividends of USD 2.311 billion total USD 14.204 billion, exceeding research FCF by USD 3.486 billion before acquisitions. Debt issuance net of repayments supplied USD 4.978 billion. Buybacks support EPS, but the funding mix weakens the argument that the entire return is internally generated surplus cash.
Our base case is continued double-digit network and services growth, a stable adjusted margin around 60%, and a recovery in cash conversion as contract spending normalizes. Those outcomes justify a quality premium; they do not make the current price obviously cheap. An illustrative 12% increase in quarterly adjusted EPS would lift USD 5.31 to USD 5.95. Annualizing and applying an assumed 28x multiple gives approximately USD 666, only about 3% above the reference close. At 25x, the same earnings imply approximately USD 595. These are valuation sensitivities, not targets or recommendations.
The reference price is the November 3, 2026 NYSE regular-session close from Stock Analysis, cross-checked against Investing.com. Another vendor displayed USD 647.30 immediately before the close. The report consistently uses USD 647.18 and excludes overnight quotations. MAON token prices are not substituted for the underlying share price.
2. Company Overview, Business Mix, and Core Operating Metrics
Mastercard operates a global payments network connecting issuing financial institutions, acquiring institutions, merchants and consumers. Its network routes transaction messages and supports authorization, clearing and settlement. Banks generally issue cards, extend consumer credit and manage cardholder repayment; Mastercard's business model is therefore different from a bank charging card interest. Settlement guarantees and counterparty exposure remain relevant even though consumer loan balances are not the central profit driver.
Revenue comes from payment-network activity and value-added services and solutions. Network economics depend on spending volumes, transactions, geographic mix, cross-border usage, contractual pricing and customer incentives. Services support functions such as fraud prevention, identity, analytics and advisory capabilities. Their value depends on solving client problems and maintaining renewal demand rather than simply placing more credentials in circulation.
Customer rebates and incentives reduce the revenue Mastercard retains from its commercial arrangements. Strong transaction growth can therefore coexist with slower net monetization if large issuer or partner contracts become more expensive. Incentives may also have a cash-payment schedule that differs from their accounting recognition. A growth analysis that ignores these contractual economics misses an important source of volatility.
|
Economic category
|
Q3 2026 evidence
|
How it earns revenue
|
Main constraint
|
|
Payment network
|
Net revenue +11%
|
Volume, transactions, cross-border activity and pricing, net of incentives
|
Client renewal economics and payment substitution
|
|
Value-added services and solutions
|
Net revenue +19%
|
Services supporting security, intelligence and client operations
|
Adoption, retention and cost to deliver
|
|
Customer relationship investment
|
Network rebates and incentives +18%
|
Supports new and renewed business; reduces retained revenue
|
Upfront cash and recovery period
|
|
Consolidated business
|
Revenue USD 9.807 billion; operating profit USD 5.862 billion
|
Combined network and service economics
|
Separate category profit contributions not disclosed here
|
Core operating metrics and changes
Q3 ended September 30 and was reported October 29. Gross dollar volume reached approximately USD 3.0 trillion, while customers had issued 3.8 billion Mastercard and Maestro-branded cards. Neither is a revenue figure. The network's earnings depend on how those credentials are used, which transactions Mastercard switches, and the fees retained after customer compensation.
|
Indicator
|
Observed result
|
Research implication
|
|
Gross dollar volume
|
+7% local currency
|
Broad spending base remains expanding
|
|
Purchase volume
|
+9% local currency
|
Purchases outgrow total GDV including cash activity
|
|
Cross-border volume
|
+11% local currency
|
Travel and international commerce remain valuable drivers
|
|
Switched transactions
|
+9%
|
Message processing grows faster than GDV
|
|
Network rebates and incentives
|
+18%
|
Contract cost grows faster than network net revenue
|
|
Adjusted EPS
|
USD 5.31; +21%
|
Includes tax and share-count support
|
|
Adjusted operating margin
|
60.5% versus 59.8%
|
Operating leverage remains positive
|
The release attributes services growth to business drivers, demand and pricing, with a minimal decrease from acquisitions and dispositions. We therefore treat the 19% growth as evidence of broad operating momentum rather than automatically attributing it to purchased revenue. It does not establish that every service category grows at the same rate or earns network-like margins.
The company's discussion of new payment platforms and commerce capabilities indicates strategic adaptation, but the release does not quantify incremental earnings from individual initiatives. This report assigns no separate valuation to announced product narratives. Repeat client usage, retained net revenue and cash return are more reliable measures of commercial success.
The category table describes economic structure rather than formal reporting segments. Revenue shares and category-level operating profit are not reconstructed from rounded growth rates. Mastercard reports consolidated profitability in these materials; assuming that its faster-growing category has the same 60.5% adjusted operating margin would introduce unsupported precision.
3. Fundamental Quality
Operating quality is strong. Q3 GAAP revenue increased by USD 1.205 billion year over year, while operating profit increased USD 801 million to USD 5.862 billion. That implies an incremental GAAP operating margin of approximately 66.5%, calculated as 801 / 1,205. The existing network scales efficiently, although litigation provisions and other period-specific costs affect the comparison.
|
Metric, USD million except EPS and margins
|
Q3 2025
|
Q3 2026
|
Nine months 2025 / 2026
|
|
Net revenue
|
8,602
|
9,807
|
23,985 / 27,482
|
|
GAAP operating income
|
5,061
|
5,862
|
|
|
GAAP operating margin
|
58.8%
|
59.8%
|
58.3% / 59.5%
|
|
GAAP net income
|
3,927
|
4,628
|
10,908 / 12,898
|
|
GAAP diluted EPS, USD
|
4.34
|
5.28
|
12.00 / 14.59
|
|
Adjusted diluted EPS, USD
|
4.38
|
5.31
|
12.25 / 14.94
|
|
Operating cash flow
|
Not shown quarterly
|
Not shown quarterly
|
12,646 / 11,859
|
|
Property expenditure
|
Not shown quarterly
|
Not shown quarterly
|
377 / 667
|
|
Capitalized software
|
Not shown quarterly
|
Not shown quarterly
|
548 / 474
|
|
Research FCF
|
Not shown quarterly
|
Not shown quarterly
|
11,721 / 10,718
|
|
Cash and equivalents, date noted
|
Dec 2025: 10,566
|
Sep 2026: 10,147
|
Restricted balances excluded
|
|
Total debt, date noted
|
Dec 2025: 19,000
|
Sep 2026: 23,938
|
Short-term plus long-term debt
|
The cash-flow comparison uses nine months in both years because that is the statement provided in the release; it is not presented as a quarterly change. Research FCF equals operating cash flow less purchases of property and equipment and capitalized software. Subtracting software captures investment that is needed to sustain the platform but is recorded outside operating expense. This definition is an analyst calculation, not a company-issued FCF measure.
Cash conversion weakened. Research FCF represented 39.0% of revenue in the first nine months, versus 48.9% a year earlier, and 83.1% of GAAP net income versus 107.5%. The absolute level remains substantial, but earnings growth alone overstates the change in distributable cash. Prepaid expenses consumed USD 4.688 billion versus USD 2.939 billion; accrued litigation and legal settlements consumed USD 537 million versus USD 4 million. Other working-capital differences also mattered, so the entire cash-flow decline should not be assigned to incentives alone.
The cash-flow statement adds back USD 2.030 billion amortization of customer incentives, up from USD 1.526 billion. That adjustment shows the timing difference between previously paid commercial investments and current accounting expense. It does not cancel the need to fund new contracts. Investors should evaluate the cash paid to secure clients, the revenue retained over the contract period and renewal terms as one economic package.
Adjusted earnings have a relatively modest Q3 gap from GAAP: USD 5.31 versus USD 5.28 EPS. The reconciliation includes USD 74 million litigation provisions and equity-investment effects, with associated taxes. However, adjusted EPS growth of 21% exceeds adjusted net-income growth of 17%, helped by fewer shares. Diluted weighted-average shares fell from 905 million to 876 million. The adjusted tax rate also declined from 21.4% to 20.1%. Both support per-share earnings without implying an equivalent improvement in transaction economics.
The balance sheet is sound relative to operating earnings but less conservative than the business's cash margins might suggest. Cash and equivalents of USD 10.147 billion compare with USD 23.938 billion total debt, implying USD 13.791 billion net debt before other investments. Restricted cash and customer security deposits are excluded from available corporate cash. Current investments of USD 317 million could modestly reduce an expanded net-debt measure, but do not change the main conclusion.
Reproducible operating-to-valuation bridge. Assume, purely for research sensitivity, that higher spending and services adoption increase Q3's USD 9.807 billion revenue base by 12% to USD 10.984 billion. Hold adjusted operating margin at 60.5%, adjusted net non-operating expense at USD 115 million and tax at 20.1%, with 876 million diluted shares. Adjusted operating income would be USD 6.645 billion, net income approximately USD 5.217 billion and EPS approximately USD 5.96. These inputs are analyst assumptions, not management guidance.
An extra one percentage point of margin on that revenue base changes quarterly after-tax profit by approximately USD 87.8 million and EPS by USD 0.10. By contrast, a five-percentage-point reduction in cash conversion expressed as FCF margin removes approximately USD 549 million quarterly cash. This comparison explains why contract cash economics can matter materially even when reported margin remains stable.
For the cash leg, a 40% research FCF margin on USD 10.984 billion revenue gives USD 4.394 billion quarterly FCF, or USD 17.574 billion annualized. Against the USD 565.0 billion equity proxy, that is a 3.11% yield. At 35% FCF margin, annualized cash falls to USD 15.378 billion and the yield to 2.72%. Neither scenario is a forecast. They quantify the cash-conversion improvement required to support the premium valuation without relying only on multiple expansion.
The single most important variable is retained cash after client acquisition and renewal spending. Healthy volume, favorable mix and services adoption are inputs; their value to shareholders depends on whether the company can retain those economics through the next contract cycle.
4. Industry and Competitive Landscape
Payments competition occurs at several layers: networks, issuing banks, merchant acquiring, digital wallets, account-to-account systems and value-added infrastructure. A wallet can be both a competitor for consumer attention and a customer using card rails. A merchant's transaction fee contains multiple components and should not be equated with Mastercard's net revenue. The company's opportunity is to remain useful as payment interfaces change, while protecting its share of the total economics.
|
Market layer
|
Position and evidence
|
Main competitors
|
Valuation implication
|
|
Global card network
|
Mastercard GDV approximately USD 3.0 trillion in Q3
|
Visa; domestic networks
|
Global acceptance and reliability support a premium
|
|
Value-added services
|
Mastercard revenue growth 19%
|
Network, security and specialist service providers
|
Growth diversifies network dependence
|
|
Closed-loop premium cards
|
American Express billed business USD 454.0 billion in Q3
|
Issuers and premium card ecosystems
|
Lending and rewards economics differ
|
|
Digital checkout and wallets
|
PayPal TPV USD 487.1 billion in Q3
|
Wallets, acquirers and bank-based payments
|
Volume growth does not guarantee monetization
|
No global market share is inferred from these figures. Mastercard GDV, Visa payments volume, American Express billed business and PayPal TPV have different scopes and may overlap. The comparison identifies economic scale and growth rather than constructing an invalid common denominator. Mastercard and Visa also have different fiscal calendars, though the periods below all ended in September.
|
Company and period
|
Revenue and growth
|
Activity indicator
|
Profitability evidence
|
|
Mastercard Incorporated; Q3 2026
|
USD 9.807 billion; +14%
|
GDV +7%; cross-border +11%; switched transactions +9%
|
Adjusted margin 60.5%; adjusted EPS USD 5.31
|
|
Visa Inc.; FY2026 Q4
|
USD 12.1 billion; +13%
|
Payments volume +9%; cross-border excluding intra-Europe +14%; processed transactions +10%
|
Non-GAAP net income USD 6.6 billion; EPS USD 3.48
|
|
American Express Company; Q3 2026
|
USD 20.062 billion net of interest expense; +9%
|
Billed business USD 454.0 billion; +8%
|
Adjusted EPS USD 4.68; +13%
|
|
PayPal Holdings, Inc.; Q3 2026
|
USD 8.6 billion; +2%
|
TPV USD 487.1 billion; +6%
|
Non-GAAP operating margin 18.8%; EPS USD 1.45
|
Source basis: official company earnings releases or SEC earnings exhibits. Revenue and profit definitions differ, particularly for American Express, which incorporates lending economics, and PayPal, which includes different checkout and processing businesses. The figures are approximately comparable indicators of operating momentum, not normalized segment accounts or a peer multiple screen.
The winners are the scaled networks and services franchises. Mastercard's 14% revenue growth and Visa's 13% suggest that both continue to monetize consumer and business activity effectively. Mastercard's services expansion adds another growth engine, but Visa's faster disclosed cross-border and transaction growth prevents a simple claim that Mastercard is winning every dimension. The two can both benefit from digital payment adoption.
PayPal is the relative monetization laggard in this comparison. Its TPV rose 6% but revenue only 2%, while non-GAAP operating margin was 18.8%. That does not mean PayPal's volume is migrating directly to Mastercard; the two can participate in the same purchase. It shows why a large transaction base alone is insufficient evidence of pricing power or attractive earnings growth.
American Express continues to benefit from its premium customer base and membership economics, with adjusted EPS growth of 13%. Its lending, funding and credit-loss exposure distinguishes it from Mastercard. The latter is a net beneficiary of digital commerce growth with less direct exposure to consumer credit losses, although spending sensitivity and settlement risk remain.
The competitive threat is ultimately economic substitution: customers choosing lower-cost rails, issuers demanding higher rebates, or services becoming easier to source elsewhere. Mastercard's defense is a combination of acceptance, reliability, security and useful client tools. That defense is strong today, but a premium multiple assumes its commercial terms remain attractive through renewals.
5. Key Risks
-
Slower consumer and travel spending: Cross-border growth falling below high single digits or switched transactions below mid-single digits would weaken revenue mix and operating leverage. These are research warning thresholds, not company guidance.
-
More expensive customer contracts: Incentive growth remaining near or above 18% while network net revenue grows around 11% would signal continuing pressure on retained economics. Upfront cash requirements can depress FCF before an accounting margin problem becomes visible.
-
Services deceleration: A sustained decline from 19% growth into low double digits would reduce the diversification benefit and make the consolidated business more dependent on network pricing and travel.
-
Regulation and litigation: Adverse rules or settlements concerning routing, interchange, surcharging, data or competition could affect pricing, incentives, legal cash payments and the multiple investors accept. The report does not assume a specific pending law becomes effective.
-
Cash-funded returns falling short of announced returns: If buybacks and dividends continue to exceed FCF, debt may rise or future repurchases may slow. A smaller share-count benefit would expose the difference between net-income growth and EPS growth.
-
Technology, fraud or settlement disruption: A significant outage or security incident could reduce usage, require remediation, damage customer retention and increase regulatory scrutiny. Settlement guarantees also create counterparty exposure during financial stress.
-
Multiple compression: At roughly 30.5x annualized Q3 adjusted EPS, slower growth can produce a disproportionate price response. The 25x sensitivity in the conclusion illustrates this risk even if earnings continue rising.
6. Monitoring Checklist
-
Network volumes: Cross-border growth around or above 10% and switched transaction growth near 9% support the base case; a persistent move below the risk thresholds would weaken it.
-
Services growth: Sustained mid-to-high-teens expansion supports the improving mix; low-double-digit growth would reduce confidence in the premium.
-
Incentives versus network revenue: Watch the gap between 18% incentive growth and 11% network net-revenue growth. A narrowing gap is constructive; widening pressure through renewed contracts is negative.
-
Adjusted margin: Approximately 60% supports the operating model. Compression exceeding one percentage point without a clear temporary cause would weaken the earnings bridge.
-
Research FCF: Track OCF less property expenditure and capitalized software. Recovery from the nine-month 39.0% FCF margin supports the thesis; further decline toward 35% would materially reduce cash yield.
-
Capital returns and net debt: Compare repurchases plus dividends with internally generated FCF, and follow USD 13.791 billion starting net debt. Repeated debt-funded excess distributions would reduce balance-sheet flexibility.
-
Tax and shares: Separate operating growth from the Q3 adjusted tax rate of 20.1% and 876 million diluted shares. A higher tax rate or slower repurchases can reduce EPS growth without a change in revenue.
Material boundaries: no independently verified timestamped consensus dataset is used, so this report does not claim an earnings beat or miss. The official release includes detailed balance-sheet and cash-flow statements; a complete Q3 10-Q and call transcript were not used for the analysis. Category revenue shares, category margins and the precise split of prepaid cash among incentive types are not invented. The next-quarter model and valuation multiples are explicit research sensitivities, not company guidance.
Selection audit: MAON, LLYON and COSTON official spot trading interfaces were opened November 4 with populated quotes and trading controls; official issuer-mapping announcements identify Mastercard, Eli Lilly and Costco. Mastercard was last covered July 31, 96 days earlier; Costco was covered within 90 days. Mastercard was selected for the October 29 results and the user's requested sector rotation. Cached token quotes are excluded from equity valuation. MAON provides tokenized economic exposure and is not represented as direct registered ownership of Mastercard shares.
7. Sources



 Transfer