
Bitcoin Signals Strength as Technical Indicators Flash Rare Buy Setup


Bitcoin is eyeing a major move after a 25% rally to $75,300. Weekly MACD and RSI signals suggest a bullish shift, but reclaiming the critical $78,000 resistance remains the key.
Bitcoin appears to be strengthening again after a dramatic rebound from recent lows, with a 25 percent rally frombelow$60,000. As the bullish case begins to grow, important technical signals are beginning to appear in the charts that traders often relate to the beginning of bullish moves.
As BTC is now trading in the region of circa $75,300 focus is increasingly turning to whether it can recapture the all-important level of circa $78,000 and push higher.
Strong Recovery Reshapes Market Sentiment
The recent rally represents a notable change of sentiment. After falling beneath $60,000, Bitcoin has managed to recover some ground, pushing it close to earlier peaks of approximately $78,380.
On TradingView, you can see the overall structure is still valid, even despite a slight correction, and has been strong enough to give traders some peace of mind that the trend is not shifting, given price is still holding above the support areas.
Although geopolitical issues, such as the wildcards surrounding the US involvement and the Israel Iran stick, caused short-term volatility, the long-term trend seems to be settling.
MACD Signals a Major Bullish Shift
Perhaps the most crucial development is from the Moving Average Convergence Divergence indicator (MACD). A bullish crossover has occured on the weekly time frame, a pattern often the precursor to several months of sustained gains.
MACD = EMA_{12}(P) - EMA_{26}(P)
It is said that a ‘golden crossover’ when the short-term moving average (generally the 50-day line) crosses up through the 200-day line and becomes the dominant indicator a sign that momentum is strengthening for buyers. This is often regarded as the sign of a new bullish trend.
Market analyst Sykodelic believes that this signal is putting Bitcoin in a promising position to continue climbing during the next day or two, or even weeks.
RSI Confirms Growing Momentum
Supporting the bullish picture, the Relative Strength Index has now made a higher low along with the MACD. The RSI hasn‘t been overbought, so there is potential for the uptrend to continue.
RSI = 100– –8457148– Interpret It RSI = 100 – 100 / 1 + RS
This is a significant balance. This suggests buying strength is increasing but not at a point where correction becomes likely.
The combination of MACD and RSI alignment is a rare one, and many traders read this indicator as a strong buy.
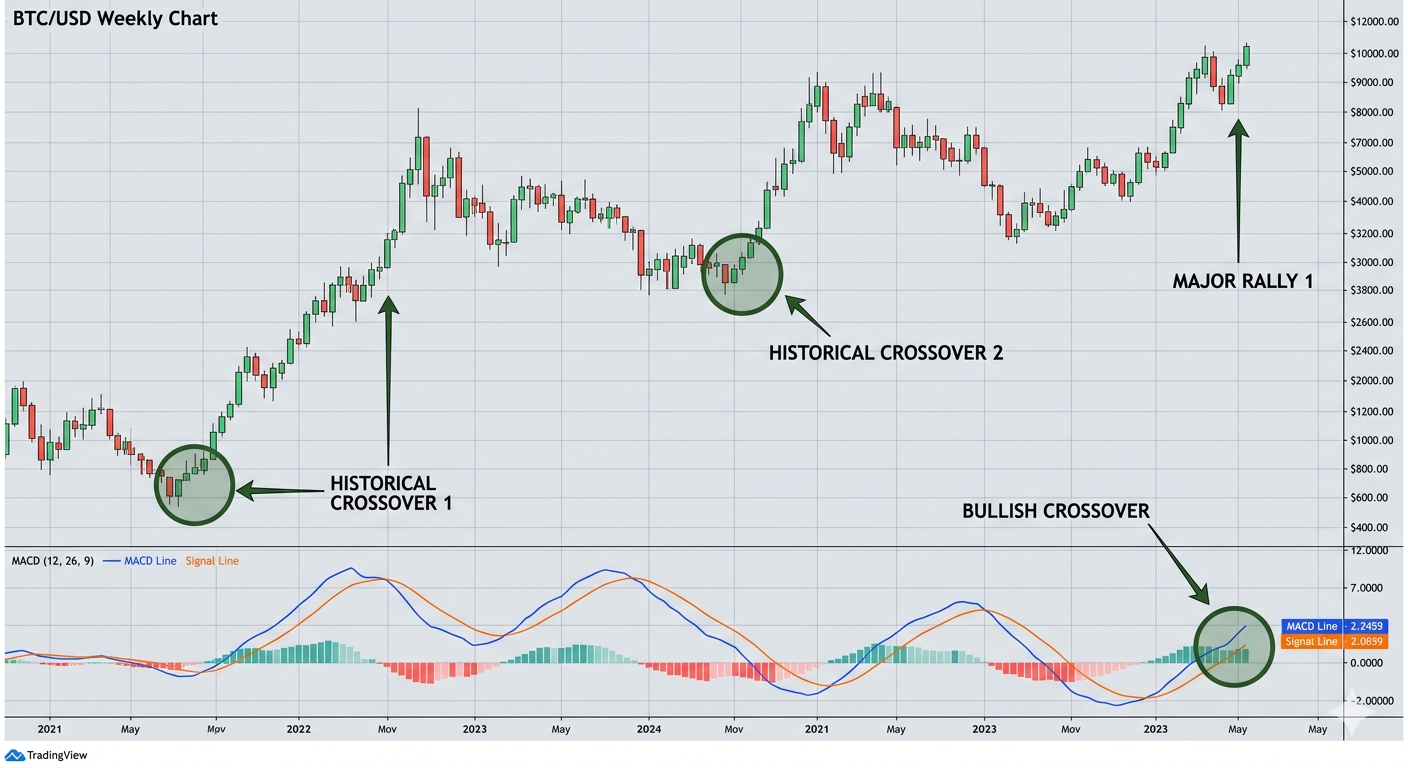
A weekly BTC/USD chart featuring a bullish MACD crossover. It highlights the MACD line moving above the signal line, marking historical points where this led to major price rallies.
The $78,000 Level Remains Critical
The bullish picture remains. Bitcoin will need to the squeeze above $78k (which provided resistance) and hold to provide ongoing bullish continuation.
This level is important because it represents:
Recently localhigh;
A zone of psychological resistance
A breakout confirmation point
If the SAR fails to push through it may just continue to consolidate whilst if reclaim is achieved it may lead to further targets being cracked.
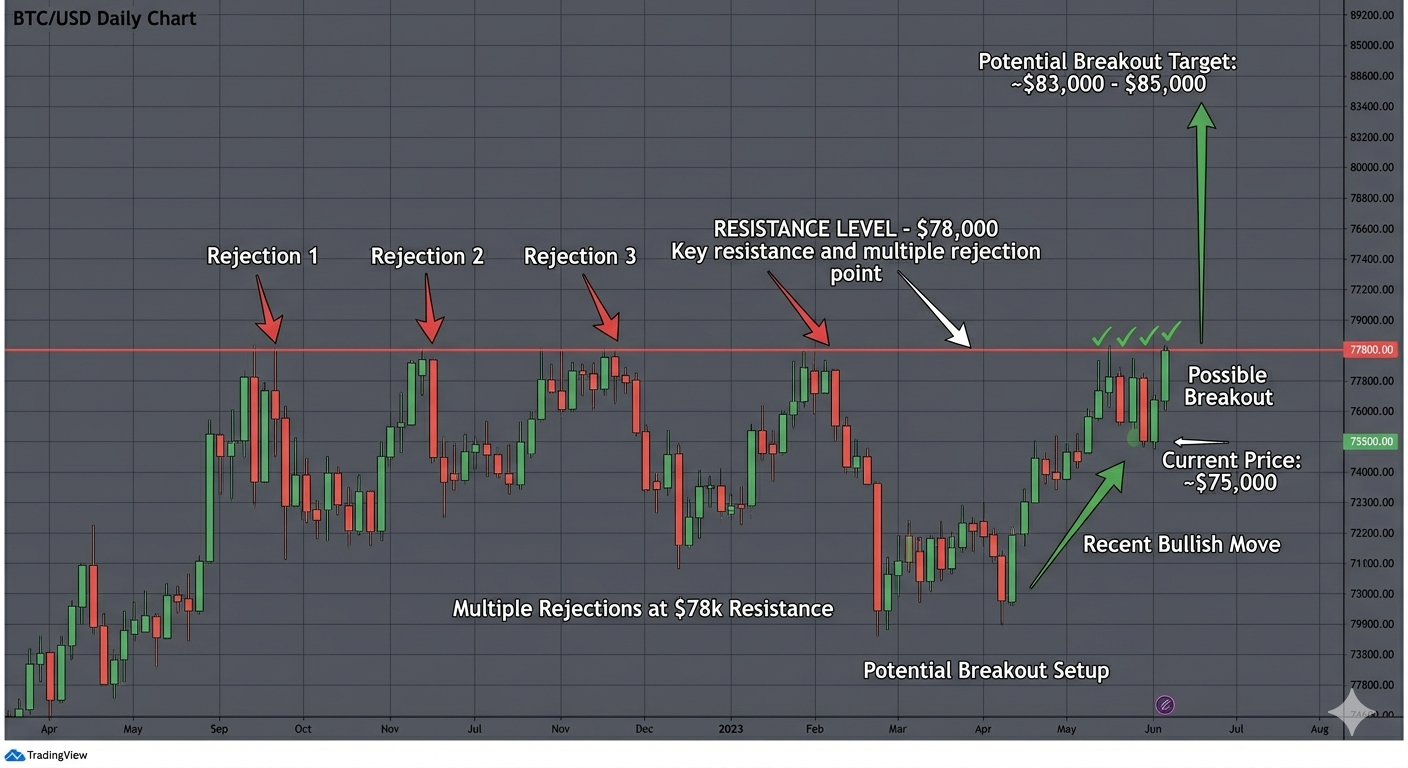
Bitcoin daily chart showing multiple rejections at $78,000 resistance. Price sits at $75,000, eyeing a breakout toward $83,000+ as momentum builds.
External Factors Still in Play
Provided that the technical picture is bullish, macro and geopolitical issues will be the wildcards, preventing the bull trend from becoming a full blown trend. Middle east tensions can spark off huge volatility swings at any moment, and the wildcards will surely have their say.
In addition, there is the potential impact of more general indicators such as interest rate expectations, global liquidity, etc, in finding the direction that can be maintained.
Market Outlook
Therefore, with a strong recovery, bullish MACD crossover, and bullish positioning of the RSI, the indications are that BTC is moving up into a new phase. Confirmation is only needed through current price action.
If BTC successfully reclaims $78,000, it could trigger:
The heightened institutional interest
Towards momentum buyings
A further advance into the higher resistance zones.
Meanwhile, the inability to breach this level could cause a delay to the rally and some short-term consolidation.
Conclusion
Bitcoin’s retracement of 25 percent from its recent lows has reignited the bullish momentum. Signs of a potential rally are evident, as both the MACD and RSI indicators support demand.
Nevertheless, what always counts is still the 78,000 level. If Bitcoin is able to break and stay above, this is definitely the beginning of a long-term bullish trend. If not, then it is only a bounce from bottom.


