
Solana Eyes Recovery as MACD Bullish Crossover Signals Early Reversal Toward $90


Solana is attempting a recovery toward $90 as strong support at $80 holds, with early technical signals pointing to a potential bullish shift.
Solana is showing early signs of recovery as price pushes toward the $90 resistance level, with the $80 support zone holding firm across multiple weekly sessions and preventing further downside. Although the broader structure remains tilted to the downside, emerging technical signals are beginning to support a bullish shift.
If momentum continues to build, a breakout attempt above $90 could soon come into focus.
$80 Support Holds as Solana Stabilizes After Downtrend
The $80 support level formed after a strong bearish trend. Solana dropped from a high near $240 around mid-September 2025 and continued falling into early 2026. During this decline, price broke several key support levels, showing strong selling pressure.
In the first week of February, buyers stepped in around the $80 level, helping to stop the downtrend. Since then, price has been moving sideways near this zone, showing signs of consolidation.
This type of consolidation after a sharp decline often suggests that selling pressure is weakening and the market may be preparing for a recovery. If price breaks above the $90 resistance level and holds above it, stronger upside movement could follow.
MACD Shows Bullish Crossover
The Moving Average Convergence Divergence (MACD) has recently formed a bullish crossover on the weekly timeframe. This suggests that momentum is starting to shift in favor of buyers.
MACD Line: -19. Signal Line: -20
Over the past few weeks, bulls have remained relatively strong despite pressure from the $90 resistance level. This level has continued to reject upward price moves, keeping Solana below it.
In the current weekly session, price attempted to push higher but was rejected again at $90. However, bullish sentiment has helped price hold above $80, with the $83 area now acting as a short-term support zone to watch.
RSI Reflects Rejection at $90
The Relative Strength Index (RSI) also highlights the rejection at the $90 resistance level, as price pulled back after testing this zone. This pullback caused the RSI to turn lower, reflecting short-term weakness.
However, the RSI remains above its moving average, which suggests that bullish momentum is still present. Despite the rejection, buyers continue to hold some control of the market.
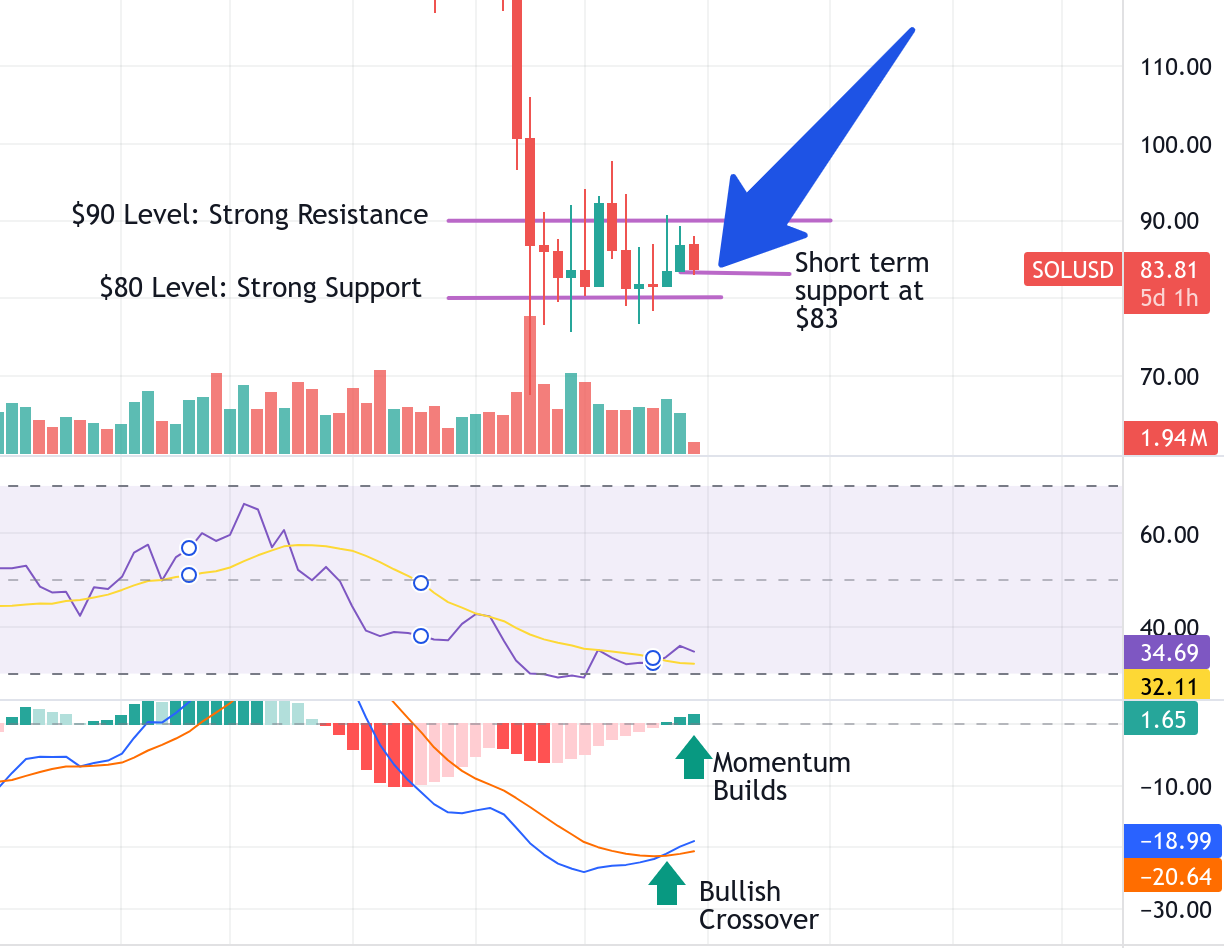
A weekly SOL/USD chart featuring a bullish MACD crossover. Also it shows MACD moving above the signal lines
$90 Remains a Critical Level
Solana is showing signs of recovery, but the $90 resistance level continues to limit further gains. A clear break above this level is needed to support continued upward movement.
At the same time, both the $80 support and $90 resistance levels are holding firm. This suggests that price may continue to move sideways if neither level is broken.
However, the MACD histogram is turning positive and gradually increasing. This indicates growing bullish momentum and suggests that the market may attempt to move higher.
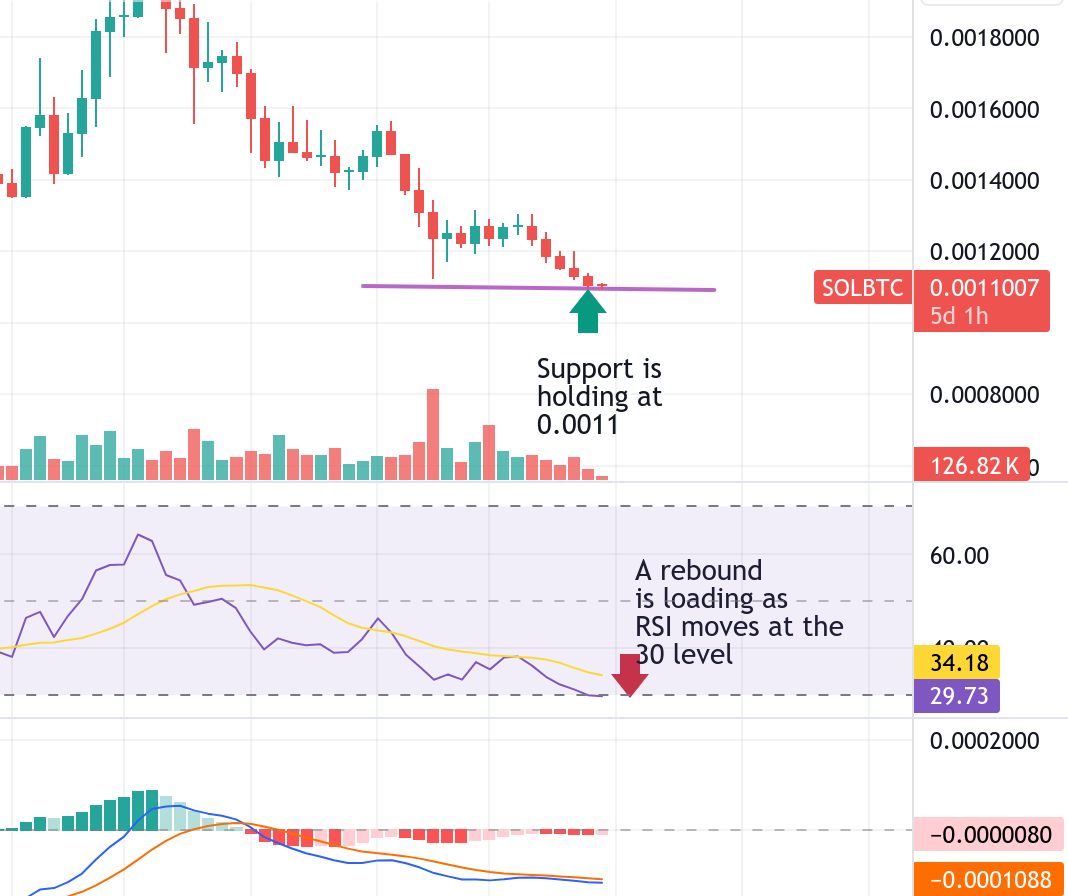
SOLBTC shows signs that bearish momentum is slowing, with a key support level forming around 0.0011. This loss of selling pressure could open the door for a potential move higher.
Fundamentals Support Long-Term Outlook
Solana’s fundamentals remain strong despite recent price weakness. The network continues to see steady user activity, with ongoing development across DeFi and NFT projects.
Institutional and developer interest in the Solana ecosystem also remains stable, supporting long-term growth. In addition, improvements in network performance and scalability have helped maintain confidence in the project.
While short-term price action is still uncertain, these fundamentals provide a solid base that could support a recovery over time.
Conclusion
Solana is showing early signs of recovery, supported by strong holding at the $80 level and improving momentum indicators. However, the $90 resistance remains a key barrier that must be cleared to confirm further upside.
A break above $90 could open the door for a stronger bullish move. On the other hand, failure to break this level may keep the price in a sideways range or lead to another pullback toward support. For now, price action around these key levels will determine the next direction.


