Author: LBank Research Analyst: Ludo
Disclaimer: This report is compiled and analyzed from publicly available information and is intended solely for information sharing and research discussion. It does not constitute investment advice, a securities recommendation, a trading instruction, or any guarantee of returns. The company operations, valuations, market prices, and consensus expectations discussed herein may change over time. Readers should independently verify the data and make their own decisions.
1. Core Conclusion
Overall judgment: Apple is an exceptional company, but the stock is overpricing a clean AI-led upgrade cycle; the risk-reward bias is negative at roughly 37.5 times mechanically calculated TTM GAAP earnings, and the first variable is whether iPhone 18 Pro, iPhone Duo, and Siri AI can convert product interest into sustained high-teens iPhone growth without sacrificing normalized margin.
-
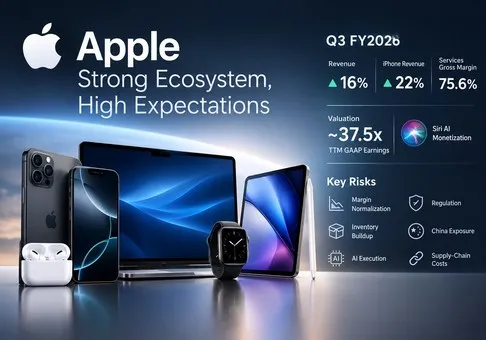
The franchise is strengthening, not fading. Fiscal Q3 2026 revenue rose 16% to USD 109.4 billion, iPhone revenue rose 22%, Mac rose 29%, Services rose 12%, and every geographic segment grew double digits. Apple also reported more than 2.5 billion active devices in fiscal Q1. This combination gives Apple unusually broad distribution for new AI features and a large installed base from which to monetize upgrades, cloud storage, advertising, payments, and content.
-
The September launch attacks both premium replacement demand and a new form factor, but price and execution risk are rising together. iPhone 18 Pro begins at USD 1,199, iPhone 18 Pro Max at USD 1,299, and the first foldable iPhone Duo at USD 1,999. Siri AI is initially a beta, while iPhone Duo does not ship until October 23. The product stack can lift average selling price and mix, but it also asks consumers to pay premium prices before Apple has disclosed adoption, retention, or monetization metrics for Siri AI.
-
Cash generation is elite, yet the latest margin headline overstates the underlying run rate. Q3 gross margin was 50.1%, but approximately two percentage points came from tariff refunds; EPS of USD 2.02 included USD 0.11 from the same factor. Excluding that benefit, gross margin was about 48.1% and EPS about USD 1.91, still roughly 22% above the prior year. Nine-month operating cash flow was USD 117.0 billion and capex was only USD 6.8 billion, but inventory nearly doubled from fiscal year-end to USD 11.1 billion ahead of the launch cycle.
-
The stock already discounts more than excellent execution. At the September 15 close of USD 331.34 and a market capitalization of about USD 4.84 trillion, Apple traded at approximately 37.5 times mechanically calculated TTM GAAP net income and 34.6 times TTM FCF. Those multiples require the Q3 acceleration to persist after tariff refunds normalize, even though R&D grew 32% in the quarter and the global smartphone market contracted 7.4% in Q2 2026.
-
Services and ecosystem lock-in are the strongest asset; valuation and an unproven AI conversion funnel are the largest weakness. Services generated USD 30.7 billion in Q3 at a 75.6% gross margin, while the App Store reached 850 million average weekly users in 2025. The thesis would improve if iPhone revenue sustains growth above 15%, Services remains above 12%, and normalized gross margin stays near 48% while Siri AI drives measurable paid usage. It would deteriorate if iPhone growth falls below 8%, Services slips below 10%, or fiscal Q4 inventory and channel promotions rise faster than sales.
The key transmission chain is measurable. As an explicit sensitivity rather than a forecast, 10 million incremental premium devices at a USD 1,200 average selling price would add USD 12.0 billion of revenue. At a 40% product gross margin, that produces USD 4.8 billion of gross profit; after a 21% illustrative tax rate and before incremental operating expense, the maximum net-income contribution is about USD 3.8 billion, or only 3% of mechanically calculated TTM net income. Even a successful premium launch therefore needs Services attachment, repeat upgrades, or materially higher volume to justify the current valuation by earnings alone.
2. Company Overview, Business Mix, and Core Operating Metrics
Apple monetizes a vertically integrated consumer-technology ecosystem. Hardware brings users into the installed base; proprietary silicon and operating systems improve differentiation and retention; Services monetize engagement through the App Store, cloud, advertising, payments, media, warranties, and licensing. The economic center remains iPhone, but the profit center is increasingly shared with Services because Services carries a much higher gross margin.
iPhone accounted for almost half of Q3 revenue and grew primarily because of higher Pro-model sales. That mix matters more than unit growth alone: premium models carry higher prices, stimulate accessories and AppleCare, and increase the addressable base for advanced Apple Intelligence features. Mac grew 29% on stronger laptop sales. iPad declined 6%, revealing that not every installed-base category is participating in the acceleration. Wearables, Home and Accessories grew 6%, a steadier but lower-growth contributor.
Services represented 28.1% of Q3 revenue but 42.4% of gross profit. Advertising and cloud services were the disclosed growth drivers. The segment benefits from the installed base, integrated payments and identity, and an App Store that averaged 850 million weekly users in 2025. Apple disclosed more than USD 1.4 trillion of developer billings and sales facilitated by the App Store ecosystem in 2025, although more than 90% did not pay Apple a commission; ecosystem commerce is therefore evidence of reach, not Apple revenue.
|
Q3 FY2026 category
|
Product, customer, and model
|
Revenue
|
YoY
|
Revenue share
|
Margin or KPI
|
Research judgment
|
|
iPhone
|
Premium and mass-market smartphones sold through direct and carrier channels
|
USD 54.3bn
|
22%
|
49.6%
|
Growth led by Pro models
|
Primary earnings engine and launch-cycle variable
|
|
Mac
|
Laptops and desktops using Apple silicon
|
USD 10.4bn
|
29%
|
9.5%
|
Higher laptop sales
|
Strong growth, but smaller group impact
|
|
iPad
|
Tablets and accessories for consumers, education, and enterprise
|
USD 6.2bn
|
-6%
|
5.7%
|
Lower iPad mini and iPad Air sales
|
The clearest weak hardware category
|
|
Wearables, Home and Accessories
|
Apple Watch, AirPods, home products, and accessories
|
USD 7.9bn
|
6%
|
7.2%
|
Accessories and Wearables led growth
|
Supports retention and wallet share
|
|
Services
|
App Store, cloud, advertising, payments, media, licensing, and warranties
|
USD 30.7bn
|
12%
|
28.1%
|
75.6% gross margin
|
Highest-quality profit pool
|
|
Total
|
Integrated hardware, software, and Services ecosystem
|
USD 109.4bn
|
16%
|
100%
|
50.1% gross margin
|
Excellent mix, partly boosted by tariff refunds
|
Note: Revenue shares are calculated from company-reported category revenue and may not sum precisely due to rounding. Services gross profit share equals USD 23.245 billion divided by USD 54.770 billion.
Core Operating Metrics and Changes
The immediate trigger is the September 9 hardware launch and September 14 Siri AI rollout. iPhone 18 Pro adds A20 Pro, a new variable-aperture camera, and a USD 100 higher starting price than the prior Pro generation. iPhone Duo opens a foldable category at USD 1,999, with pre-orders beginning October 16. Siri AI is available first as an English beta, which makes usage quality, regional expansion, and paid-access conversion more important than launch-day feature lists.
|
Metric or event
|
Latest value
|
Comparison
|
Basis
|
Investment meaning
|
|
Q3 revenue
|
USD 109.4bn
|
+16% YoY
|
GAAP, quarter ended June 27
|
Broad acceleration establishes a high base for the launch cycle
|
|
Gross margin
|
50.1%
|
46.5% prior year
|
Includes about 2ppt from tariff refunds
|
Normalized margin near 48.1% is still strong but less exceptional
|
|
Diluted EPS
|
USD 2.02
|
+29% YoY
|
Includes USD 0.11 tariff-refund benefit
|
Normalized EPS near USD 1.91 grew about 22%
|
|
R&D
|
USD 11.7bn
|
+32% YoY
|
GAAP quarterly expense
|
AI and infrastructure investment is rising faster than revenue
|
|
iPhone 18 Pro and Duo
|
USD 1,199 / USD 1,999
|
Pro launch September 18; Duo launch October 23
|
U.S. starting prices
|
Higher ASP opportunity with affordability and execution risk
|
|
Market valuation
|
USD 331.34 per share
|
USD 4.84tn market cap
|
September 15 close; secondary fixed-date data
|
About 37.5x TTM GAAP earnings and 34.6x TTM FCF
|
The core earnings slope now depends on premium mix rather than a simple unit rebound. Q3 iPhone revenue grew 22% while the smartphone market contracted, showing share and mix gains. The next test is whether the new USD 1,199 Pro floor and USD 1,999 Duo expand revenue per user without forcing more carrier subsidies or Apple-funded financing.
Siri AI can strengthen replacement demand and Services engagement, but monetization is not yet disclosed. Apple states that expanded access to some server-side AI features will be available for a fee in the future. Until paid conversion, usage, and compute cost are visible, the near-term financial contribution should be treated as a hardware-retention mechanism rather than a standalone profit pool.
3. Fundamental Quality
|
Metric
|
FY2023
|
FY2024
|
FY2025
|
9M FY2026
|
Research judgment
|
|
Revenue
|
USD 383.3bn
|
USD 391.0bn
|
USD 416.2bn
|
USD 364.4bn
|
Growth accelerated to 16% in the latest nine months
|
|
GAAP gross margin
|
44.1%
|
46.2%
|
46.9%
|
49.1%
|
Mix is favorable; Q3 included a temporary refund
|
|
Net income
|
USD 97.0bn
|
USD 93.7bn
|
USD 112.0bn
|
USD 101.5bn
|
Nine-month growth of 20% confirms operating leverage
|
|
Operating cash flow
|
USD 110.5bn
|
USD 118.3bn
|
USD 111.5bn
|
USD 117.0bn
|
Nine-month cash conversion materially improved
|
|
FCF
|
USD 99.6bn
|
USD 108.8bn
|
USD 98.8bn
|
USD 110.2bn
|
Capital-light economics remain exceptional
|
|
Capex
|
USD 11.0bn
|
USD 9.4bn
|
USD 12.7bn
|
USD 6.8bn
|
Low relative to revenue, despite rising AI expense
|
|
Cash and marketable securities / debt
|
Not shown
|
Not shown
|
USD 132.4bn / USD 98.7bn
|
USD 146.5bn / USD 84.3bn
|
Net cash and declining debt preserve flexibility
|
Note: FCF equals operating cash flow less payments for property, plant and equipment. Nine-month figures are not annualized. Debt includes commercial paper and current plus non-current term debt.
Growth and margin. Revenue expanded only 2% in FY2024 and 6% in FY2025, then accelerated 16% in the first nine months of FY2026. The improvement is real, but Q3 comparisons benefited from premium iPhone mix, foreign-exchange tailwinds in some regions, and tariff refunds. Services creates structural margin support, while the latest product cycle raises hardware mix.
Cash flow and capital intensity. Nine-month operating cash flow of USD 117.0 billion exceeded net income by USD 15.5 billion. FCF reached USD 110.2 billion because capex was only USD 6.8 billion. Apple can invest heavily through R&D and supplier commitments without carrying hyperscaler-level owned infrastructure on its cash-flow statement. The tradeoff is dependency on manufacturing partners and suppliers.
Balance sheet and capital allocation. Apple held USD 146.5 billion of cash and marketable securities against USD 84.3 billion of commercial paper and term debt at June 27. It repurchased USD 61.8 billion of stock in nine months. Repurchases reduce the share count, but buying at a high-30s earnings multiple offers less accretion per dollar than in lower-valuation periods.
Fundamental conclusion. Quality is very strong: double-digit growth, high recurring-margin Services, superior cash conversion, and net cash. The single most important variable is whether premium-device revenue and Services attachment remain double digit after the one-time margin benefit disappears.
4. Industry and Competitive Landscape
Apple competes across premium smartphones, operating systems, mobile AI, devices, app distribution, payments, cloud storage, advertising, and media. Smartphone shipment share is an imperfect measure because Apple earns far more revenue per device than mass-market Android vendors, while Alphabet monetizes Android primarily through Search, Play, and cloud rather than hardware. The most useful framework therefore combines shipments, premium mix, ecosystem reach, and segment economics.
|
Competitive dimension
|
Apple position
|
Scale or share basis
|
Main competitors
|
Valuation implication
|
|
Premium smartphone demand
|
Pro mix drove 22% Q3 iPhone growth
|
20.2% Q2 global shipments
|
Samsung, Xiaomi, OPPO, vivo
|
Share gains support premium multiples, but cyclicality remains
|
|
Installed ecosystem
|
More than 2.5bn active devices
|
Company-defined active installed base
|
Alphabet Android, Samsung Galaxy, Microsoft Windows
|
Distribution lowers customer-acquisition cost for AI and Services
|
|
Mobile AI
|
Siri AI beta integrated across Apple platforms
|
No disclosed usage or paid conversion yet
|
Google Gemini, Samsung Galaxy AI, Xiaomi MiMo
|
Strategic defense today; monetization option rather than proven profit
|
|
App distribution and Services
|
850m weekly App Store users
|
2025 average; ecosystem commerce is not Apple revenue
|
Google Play and alternative app stores
|
High-margin moat exposed to regulation
|
|
Supply and cost
|
Scale and premium mix absorb memory inflation
|
USD 57.0bn manufacturing purchase obligations
|
Samsung is both supplier and competitor
|
Procurement power protects margin but raises commitment risk
|
|
Company
|
Latest comparable period
|
Revenue or KPI
|
Growth, margin, or shipments
|
Operating and investment state
|
Competitive conclusion
|
|
Apple
|
Q3 FY2026 / Q2 calendar shipments
|
USD 109.4bn revenue; 55.7m smartphones
|
16% revenue; 14.9% shipment growth
|
R&D up 32%; Services margin 75.6%
|
Net winner in premium mix and share
|
|
Samsung Electronics
|
Q2 2026
|
KRW 171.5tn group revenue; 62.7m smartphones
|
8.1% shipment growth; 22.7% share
|
MX and Networks revenue KRW 33.2tn with KRW 0.7tn operating loss under component pressure
|
Shipment leader, but weaker mobile economics
|
|
Alphabet
|
Q2 2026
|
USD 119.8bn revenue
|
24% revenue; 34% operating margin
|
Cloud growth 82%; Gemini and Android distribute AI broadly
|
Winning in AI infrastructure and assistant scale
|
|
Xiaomi
|
Q2 2026
|
RMB 42.1bn smartphone revenue; 31.2m units
|
Shipments down 26.4% YoY; 11.3% share
|
ASP rose to RMB 1,351 as premium mix improved
|
Losing volume under memory-cost pressure
|
Note: Company fiscal calendars, currencies, and business definitions differ. Smartphone shipments and shares use IDC final Q2 2026 data; Alphabet revenue includes advertising and cloud, while Samsung group revenue is dominated by semiconductors in the period.
Apple and Samsung are winning shipment share while lower-price vendors absorb the memory-cost shock. Apple is the stronger mobile profit winner because Services and premium pricing offset hardware costs; Samsung led shipments but its MX and Networks unit posted an operating loss in Q2. Xiaomi is the clearest loser in the comparison, with shipments down 26.4% even as ASP increased.
Alphabet is the strongest competitive threat in AI distribution. Its 82% Google Cloud growth and broad Gemini deployment create more visible AI monetization than Apple currently discloses. Apple remains the net beneficiary in premium devices and ecosystem economics, but it is not yet the demonstrated winner in AI monetization. The valuation assumes it can convert distribution into profit before competitors weaken device differentiation.
5. Key Risks
-
Premium demand fails to clear the new price architecture. If iPhone growth falls below 8% after the launch or channel promotions rise materially, higher ASP will not offset weaker units. Revenue growth and product gross margin would slow together, pressuring the high-30s earnings multiple.
-
Siri AI remains a feature rather than a monetization layer. If beta quality, language coverage, or daily usage disappoints, the replacement cycle may shorten less than expected while AI-related R&D and infrastructure costs continue to grow above revenue.
-
Temporary margin support reverses. Q3 gross margin included about two percentage points from tariff refunds. If normalized product margin falls below 38% as memory and component costs rise, consolidated margin could retreat despite Services growth.
-
Inventory and launch complexity create a working-capital reversal. Inventory rose to USD 11.1 billion from USD 5.7 billion at fiscal year-end. A slower Pro or Duo ramp could require discounting, increase channel inventory, and reduce operating cash conversion.
-
App Store regulation damages Services economics. Adverse outcomes under the EU Digital Markets Act or similar rules could reduce commissions, weaken distribution control, or raise compliance expense, directly affecting the segment with 75.6% gross margin.
-
China and supply-chain concentration re-emerge. Greater China grew 22% in Q3, but Apple has USD 57.0 billion of manufacturing purchase obligations and relies on outsourced manufacturing. Demand weakness, trade restrictions, or production disruption could hit both sales and cost.
-
Capital returns become less efficient. Apple repurchased USD 61.8 billion of stock in nine months. At roughly 37.5 times TTM earnings, buybacks retire fewer shares per dollar; continued aggressive repurchases could support EPS while reducing future balance-sheet optionality.
6. Monitoring Checklist
-
Track fiscal Q4 iPhone revenue: growth above 15% would support the premium-cycle thesis; below 8% would weaken it.
-
Track normalized consolidated gross margin after tariff refunds: about 48% or better is supportive; below 47% would indicate cost or promotional pressure.
-
Track Services growth and margin: revenue growth above 12% with gross margin near 75% strengthens the ecosystem thesis; growth below 10% weakens it.
-
Track Siri AI adoption, language expansion, paid-access terms, and server-side usage limits; disclosed paid conversion would turn AI from a retention claim into an earnings variable.
-
Track iPhone Duo availability, returns, durability issues, and channel promotions around the October 23 launch; stable availability without discounting would support a premium new category.
-
Track inventory relative to sales: inventory growth above revenue for another quarter would signal launch or channel risk.
-
Track Samsung MX profitability, Xiaomi shipments, and IDC premium-market share; Apple retaining about 20% global smartphone share while rivals compress would reinforce pricing power.
-
Track R&D growth versus revenue: sustained R&D growth above 25% without measurable AI monetization would reduce operating leverage.
7. Sources